- Home >
- Stock Photos >
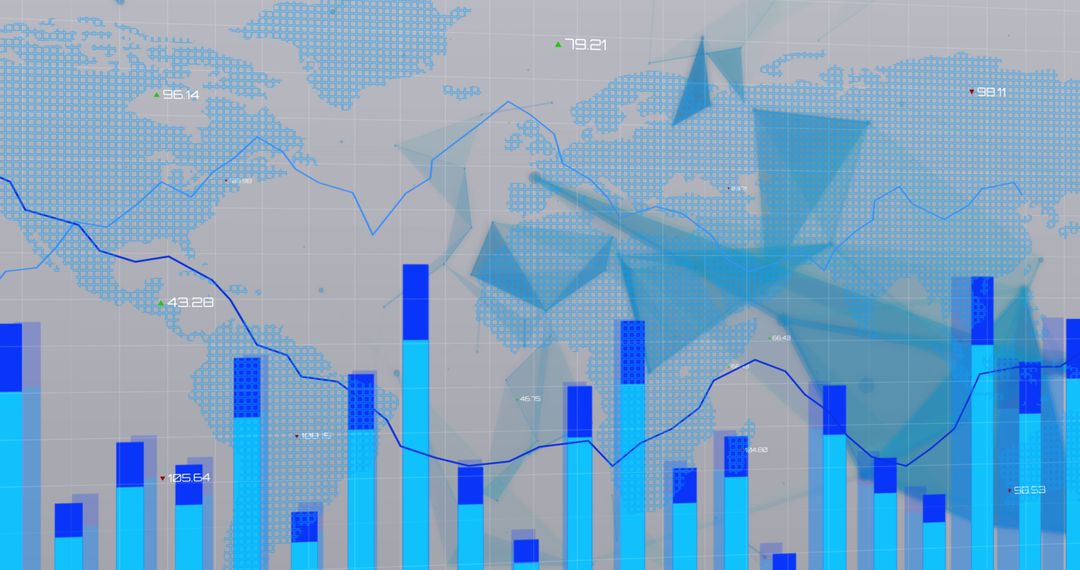
- Abstract Data Visualization with Pie Charts and Graphs
Abstract Data Visualization with Pie Charts and Graphs Image

This image displays a modern and abstract representation of data visualization involving pie charts and bar graphs with connecting lines and statistical data percentages. Ideal for presentations, business analytics reports, financial data insights, webpages focusing on global business trends, or educational materials on data processing.
Powered by 


0
downloads
downloads
Tags:
More
Credit Photo
If you would like to credit the Photo, here are some ways you can do so
Text Link
photo Link
<span class="text-link">
<span>
<a target="_blank" href=https://pikwizard.com/photo/abstract-data-visualization-with-pie-charts-and-graphs/17be388a140969518175cf450eb5e777/>PikWizard</a>
</span>
</span>
<span class="image-link">
<span
style="margin: 0 0 20px 0; display: inline-block; vertical-align: middle; width: 100%;"
>
<a
target="_blank"
href="https://pikwizard.com/photo/abstract-data-visualization-with-pie-charts-and-graphs/17be388a140969518175cf450eb5e777/"
style="text-decoration: none; font-size: 10px; margin: 0;"
>
<img src="https://pikwizard.com/pw/medium/17be388a140969518175cf450eb5e777.jpg" style="margin: 0; width: 100%;" alt="" />
<p style="font-size: 12px; margin: 0;">PikWizard</p>
</a>
</span>
</span>
Free (free of charge)
Free for personal and commercial use.
Author: Awesome Content
Similar Free Stock Images

Premium


Premium


Premium


Premium


Premium


Premium


Premium


Premium


Premium


Premium


Premium


Premium


Premium


Premium


Premium


Premium


Premium


Premium


Premium


Premium


Premium


Premium


Premium


Premium