
- Home >
- Stock Photos >
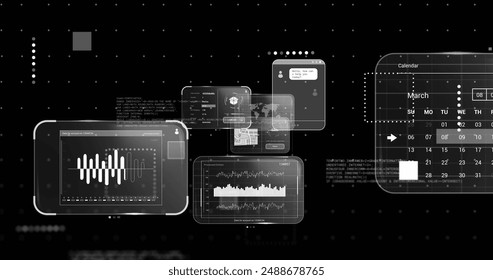
- Abstract Data Visualization with Retro Future Digital Interface
Abstract Data Visualization with Retro Future Digital Interface Image

Vibrant image of data processing waves and digital graphs symbolizes technological advancements and analytical processes of futuristic and retro aesthetics. Ideal for illustrating business analytics, digital reports, technology brochures, or educational presentations focusing on data-processing innovations or cyber digital interfaces.
Powered by  - Get 15% off with code: PIKWIZARD15


downloads
Tags:
More
Credit Photo
If you would like to credit the Photo, here are some ways you can do so
Text Link
photo Link
<span class="text-link">
<span>
<a target="_blank" href=https://pikwizard.com/photo/abstract-data-visualization-with-retro-future-digital-interface/0e76a6e9ac9639730f8f48a29fcd48cc/>PikWizard</a>
</span>
</span>
<span class="image-link">
<span
style="margin: 0 0 20px 0; display: inline-block; vertical-align: middle; width: 100%;"
>
<a
target="_blank"
href="https://pikwizard.com/photo/abstract-data-visualization-with-retro-future-digital-interface/0e76a6e9ac9639730f8f48a29fcd48cc/"
style="text-decoration: none; font-size: 10px; margin: 0;"
>
<img src="https://pikwizard.com/pw/medium/0e76a6e9ac9639730f8f48a29fcd48cc.jpg" style="margin: 0; width: 100%;" alt="" />
<p style="font-size: 12px; margin: 0;">PikWizard</p>
</a>
</span>
</span>
Free (free of charge)
Free for personal and commercial use.
Author: Awesome Content
Similar Free Stock Images

Premium


Premium

Premium


Premium


Premium


Premium


Premium


Premium


Premium

Premium


Premium


Premium


Premium


Premium


Premium


Premium


Premium


Premium


Premium


Premium


Premium

Premium


Premium


Premium


Premium


Explore More Free Stock Images