- Home >
- Stock Photos >
- Abstract Data Visualization with Statistical Charts and Symbols
Abstract Data Visualization with Statistical Charts and Symbols Image

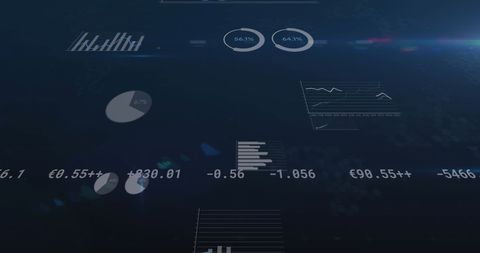
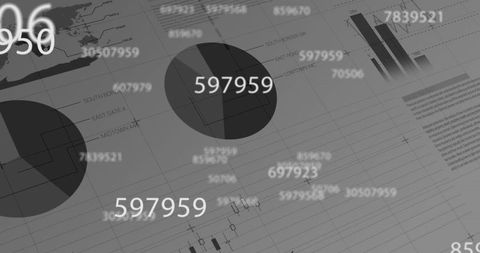
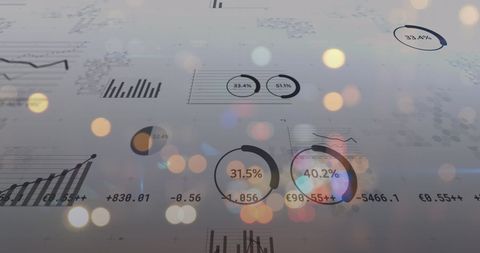
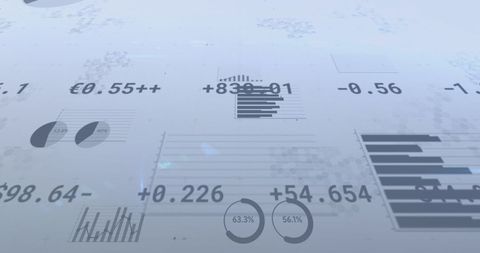
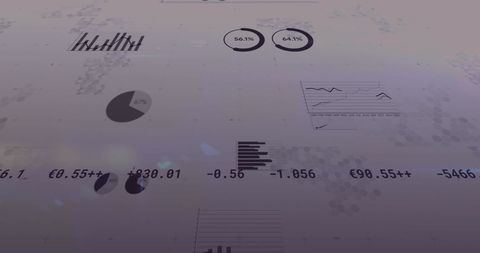
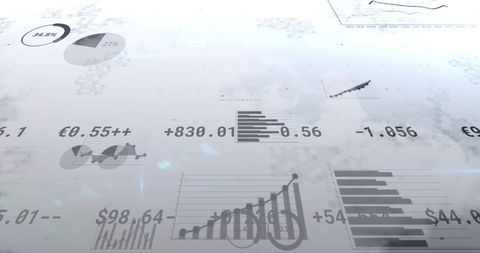
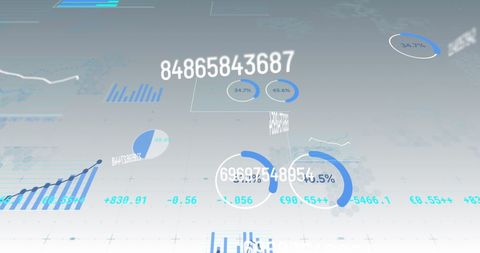
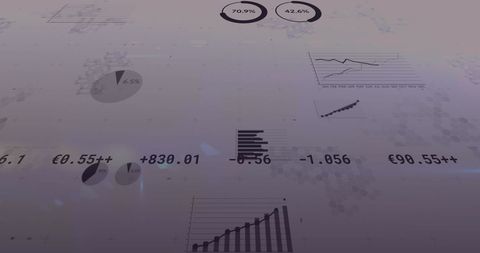
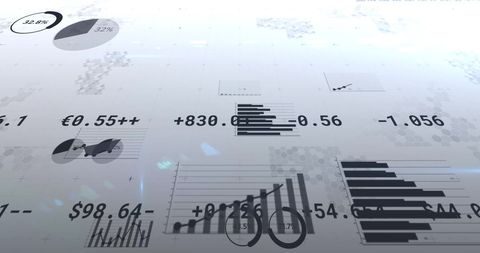
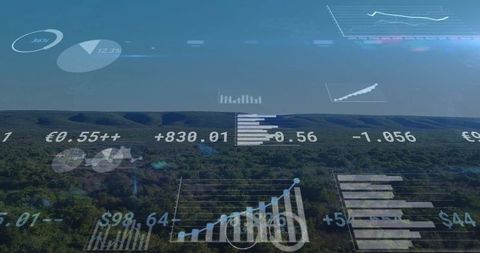
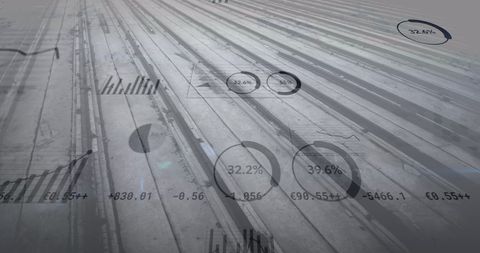
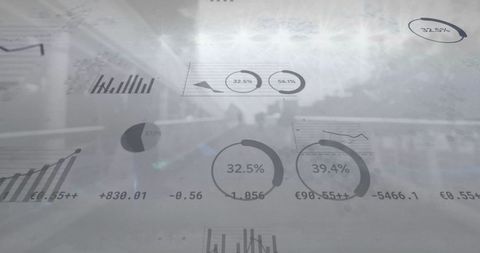
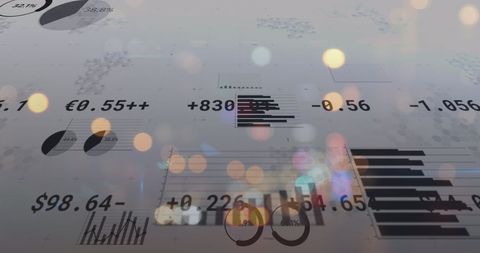
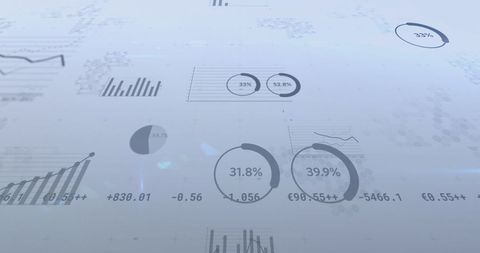
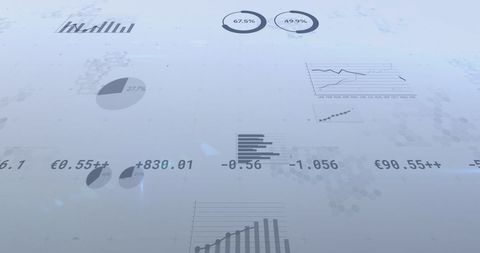
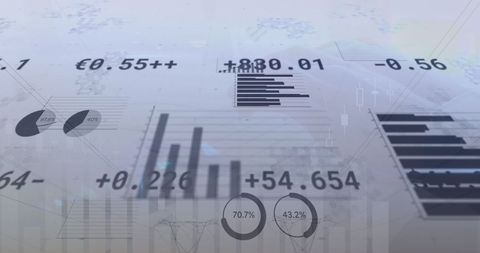
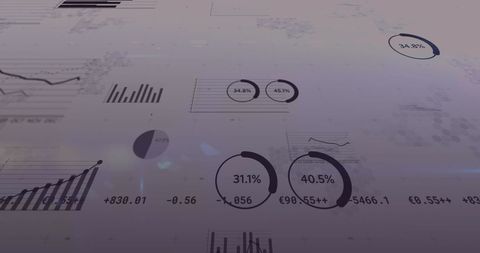
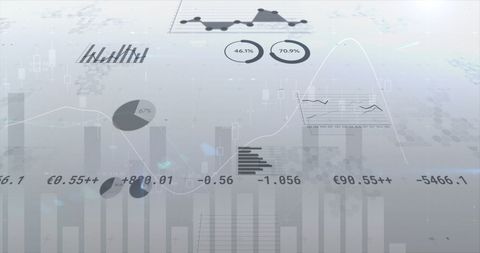
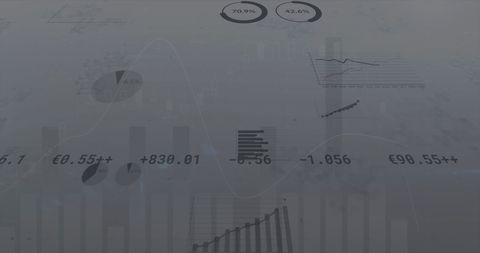
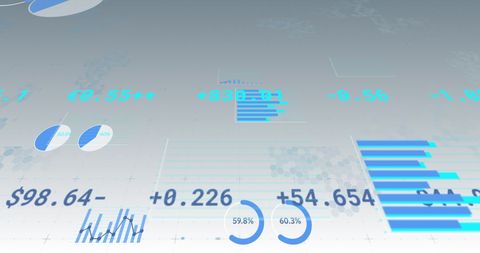
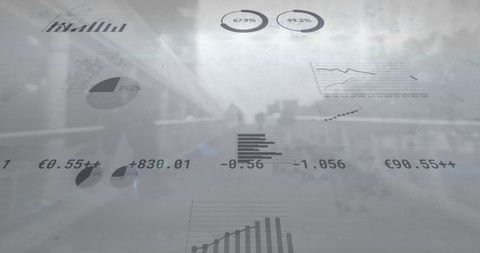
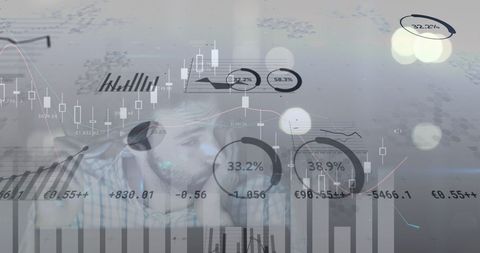
This digital design portrays various financial and statistical data representations set against a dynamic circular background. Ideal for conveying concepts in finance, business analytics, data processing, and technology. Suitable for use in digital marketing materials, financial reports, presentations, and educational content highlighting analysis and technology integration.

downloads
Tags:
More
Credit Photo
If you would like to credit the Photo, here are some ways you can do so
Text Link
photo Link
<span class="text-link">
<span>
<a target="_blank" href=https://pikwizard.com/photo/abstract-data-visualization-with-statistical-charts-and-symbols/f09b45c9acd1677b7ad47ec34875a4a3/>PikWizard</a>
</span>
</span>
<span class="image-link">
<span
style="margin: 0 0 20px 0; display: inline-block; vertical-align: middle; width: 100%;"
>
<a
target="_blank"
href="https://pikwizard.com/photo/abstract-data-visualization-with-statistical-charts-and-symbols/f09b45c9acd1677b7ad47ec34875a4a3/"
style="text-decoration: none; font-size: 10px; margin: 0;"
>
<img src="https://pikwizard.com/pw/medium/f09b45c9acd1677b7ad47ec34875a4a3.jpg" style="margin: 0; width: 100%;" alt="" />
<p style="font-size: 12px; margin: 0;">PikWizard</p>
</a>
</span>
</span>
Free (free of charge)
Free for personal and commercial use.
Author: People Creations