
- Home >
- Stock Photos >
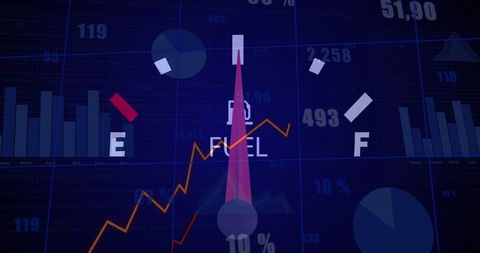
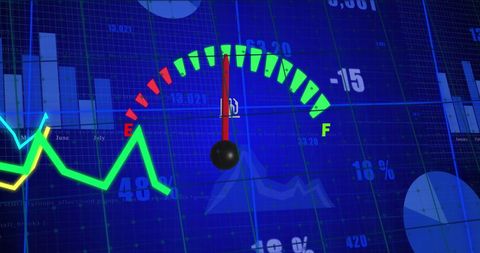
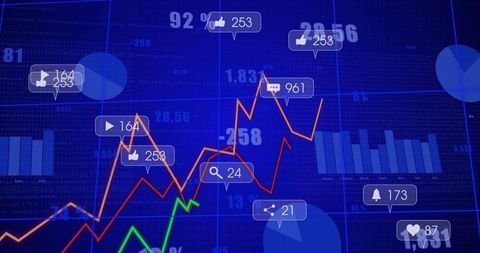
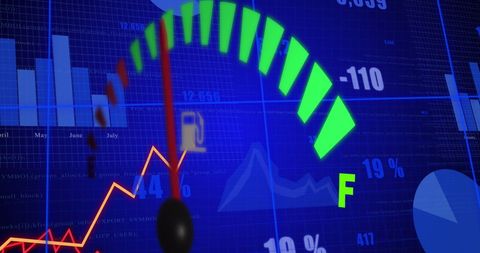
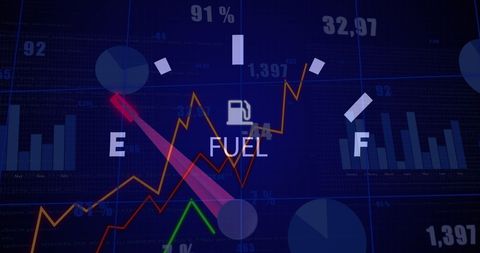
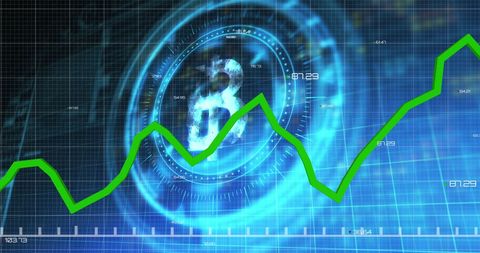
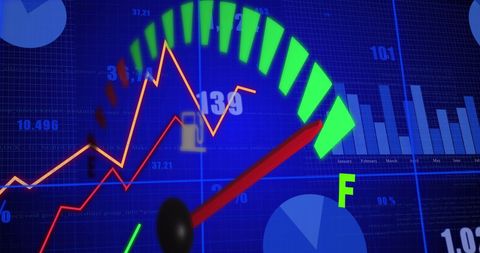
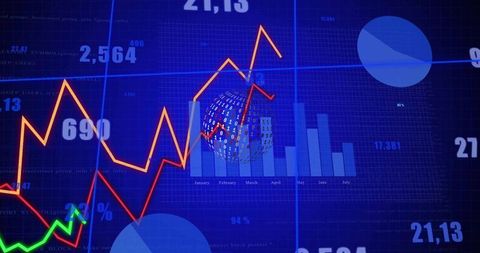
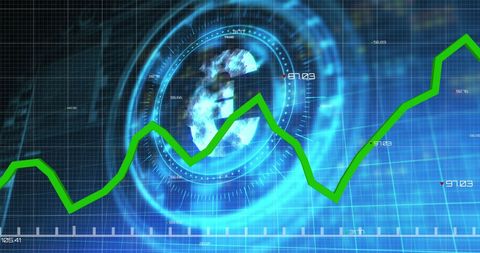
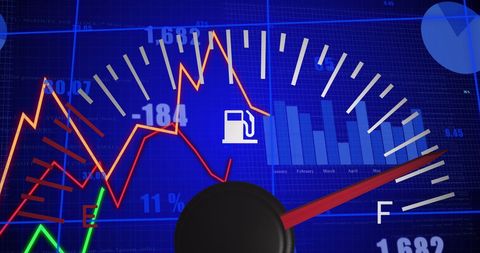
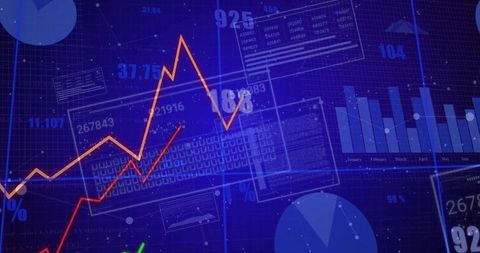
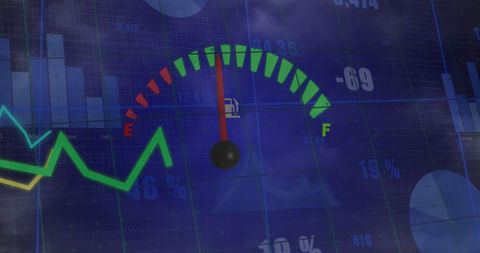
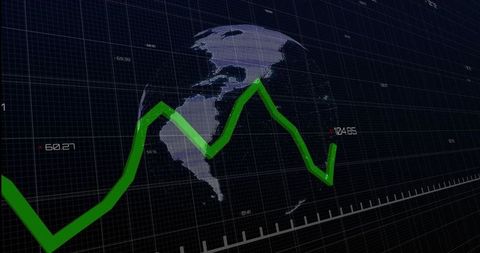
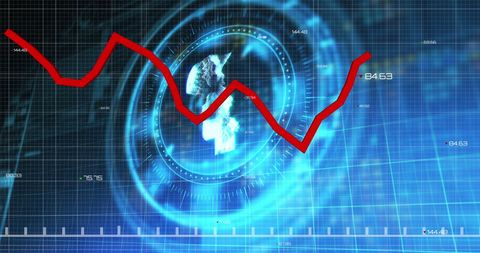
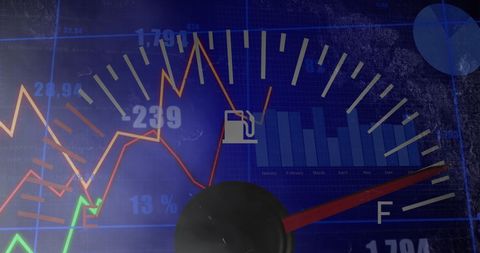
- Abstract Data Visualizations Merging Analytics and Metrics
Abstract Data Visualizations Merging Analytics and Metrics Image
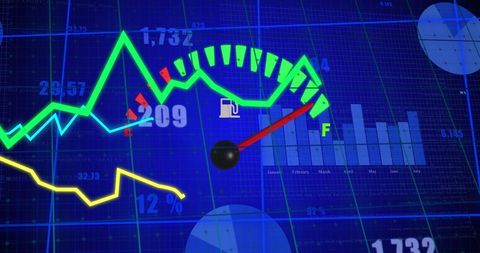
Fusion of car panel display with financial graphs, ideal for showcasing themes related to analytics, digital solutions, or business strategies. Useful in representing technological advancements in data processing or broadcasting digital financial metrics.
Powered by  - Get 15% off with code: PIKWIZARD15


downloads
Tags:
More
Credit Photo
If you would like to credit the Photo, here are some ways you can do so
Text Link
photo Link
<span class="text-link">
<span>
<a target="_blank" href=https://pikwizard.com/photo/abstract-data-visualizations-merging-analytics-and-metrics/191925f893297b16b0b31b870b0bf231/>PikWizard</a>
</span>
</span>
<span class="image-link">
<span
style="margin: 0 0 20px 0; display: inline-block; vertical-align: middle; width: 100%;"
>
<a
target="_blank"
href="https://pikwizard.com/photo/abstract-data-visualizations-merging-analytics-and-metrics/191925f893297b16b0b31b870b0bf231/"
style="text-decoration: none; font-size: 10px; margin: 0;"
>
<img src="https://pikwizard.com/pw/medium/191925f893297b16b0b31b870b0bf231.jpg" style="margin: 0; width: 100%;" alt="" />
<p style="font-size: 12px; margin: 0;">PikWizard</p>
</a>
</span>
</span>
Free (free of charge)
Free for personal and commercial use.
Author: Awesome Content
Similar Free Stock Images
Premium


Premium


Premium

Premium


Premium

Premium


Premium


Premium


Premium


Premium


Premium


Premium


Premium


Premium


Premium


Premium

Premium


Premium


Premium


Premium

Premium


Premium


Premium


Premium


Premium


Explore More Free Stock Images