1. Home > 
  2. Stock Photos > 
  3. Financial Data Charts with Analyzing Graphs on White Background

Financial Data Charts with Analyzing Graphs on White Background Image

Financial Data Charts with Analyzing Graphs on White Background

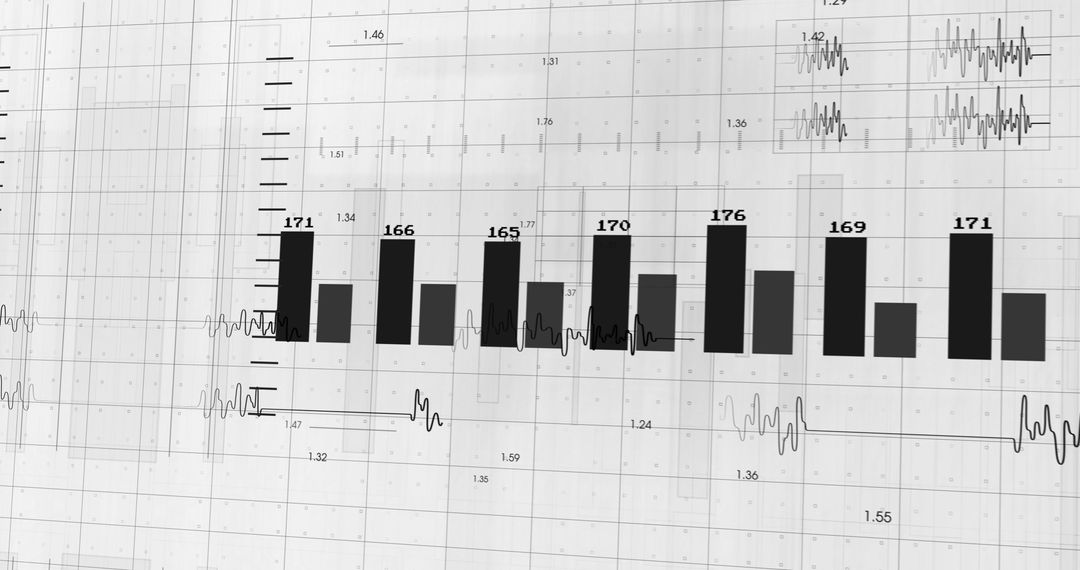
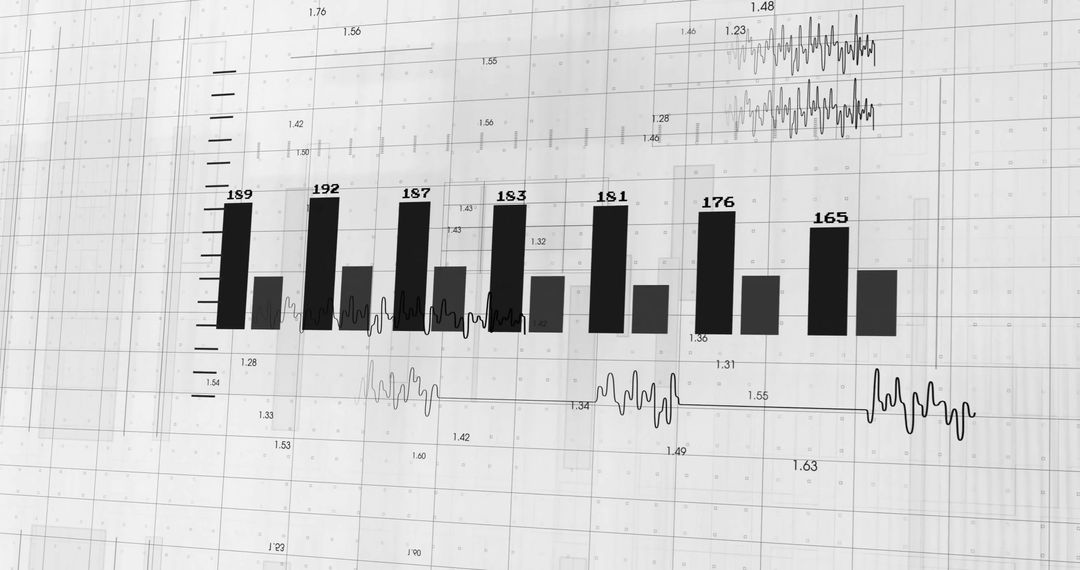
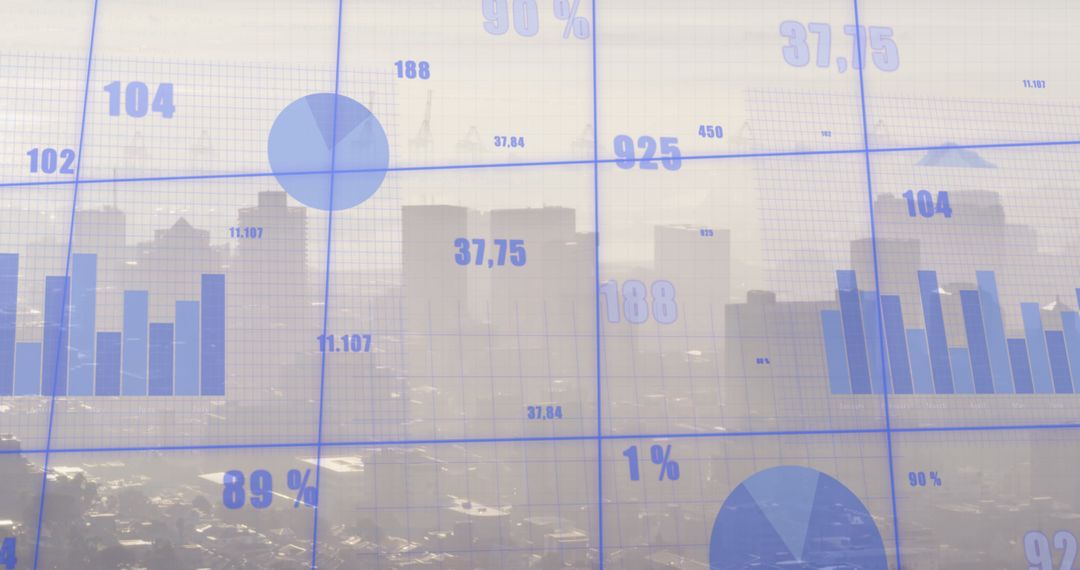
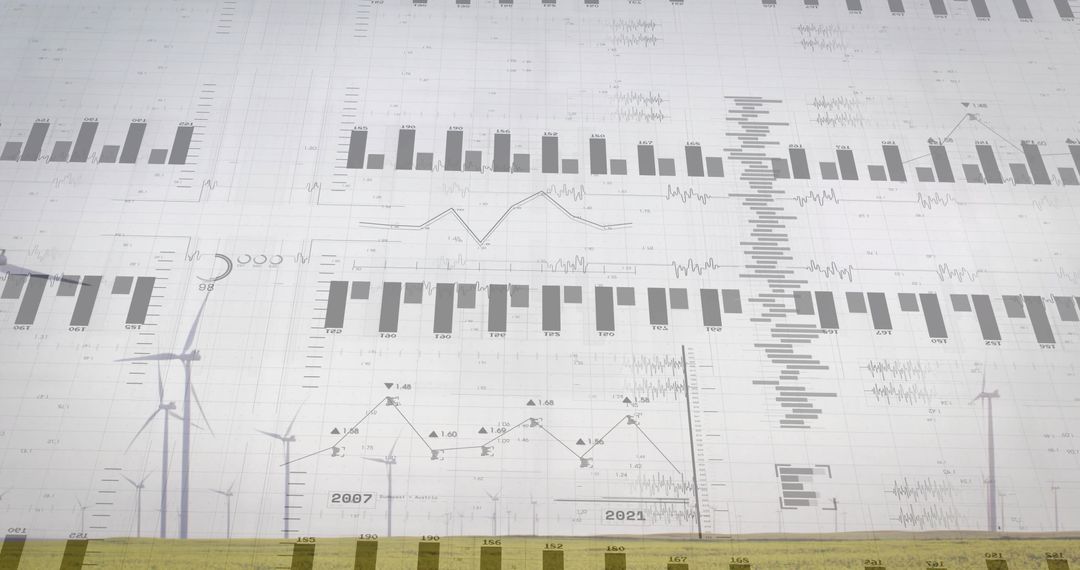
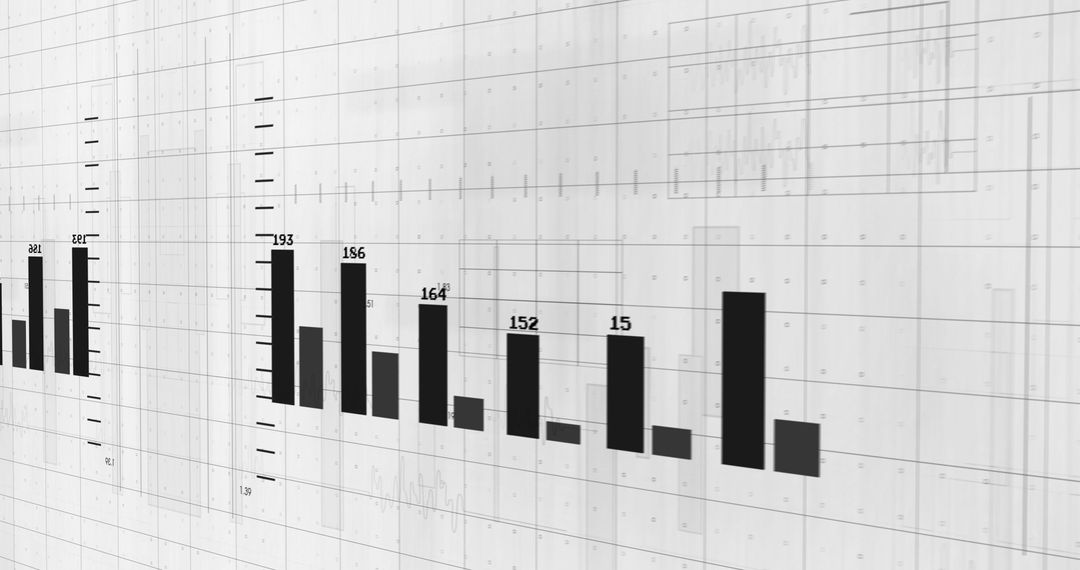
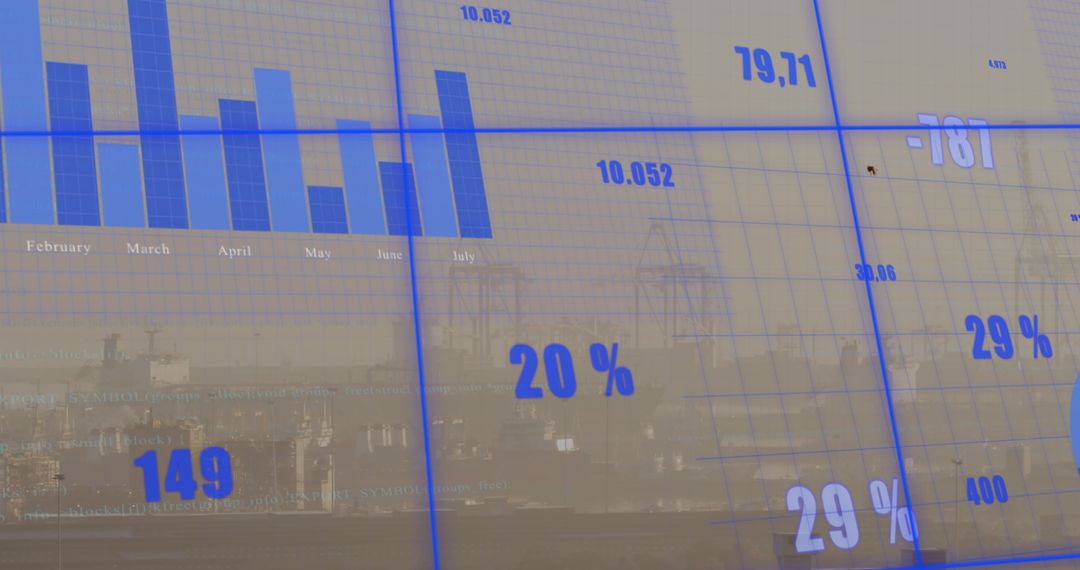
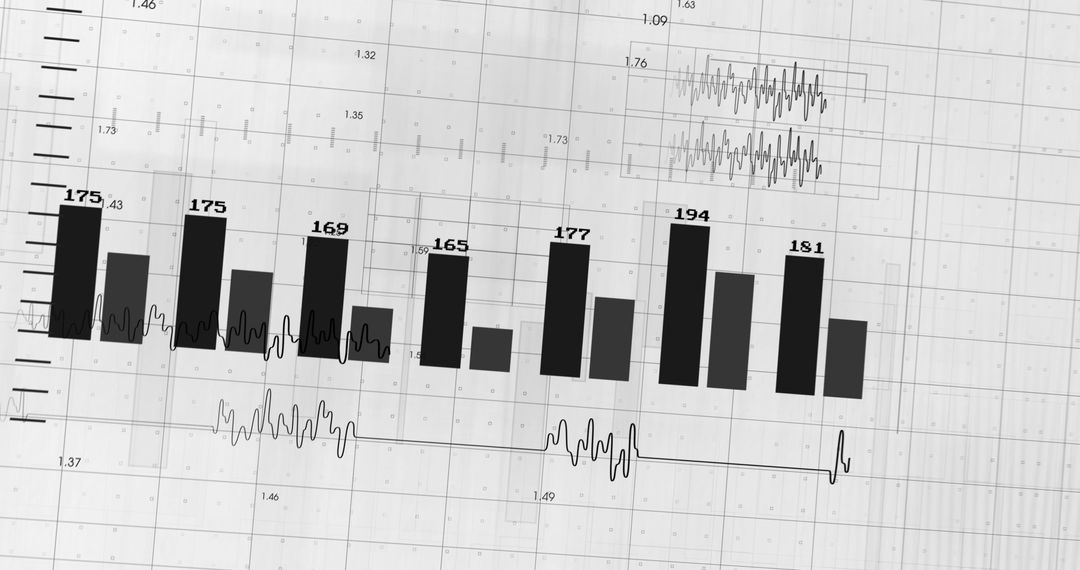
This image illustrates a complex analysis of financial data represented by charts and graphs, set on a white background. It is suited for use in presentations, reports, or websites related to business, finance, or economic studies, conveying concepts of data analysis and global financial systems.

Powered by Adobe logo
An analyst uses a computer and dashboard for data business analysis and Data Management System with KPI and metrics connected to the database for technology finance, operations, sales, marketing  - Powered by AdobeInteractive Financial Data Visualization and Predictive Analysis in Digital Platforms. - Powered by AdobeMagnifying glass focusing on candlestick chart, showcasing market analysis on a dark background, concept for financial review, investment strategy and business intelligence data analysis - Powered by AdobeBusiness partnership coworkers using a tablet to analysis graph company financial budget report and cost work progress and planning for future in office room. - Powered by AdobeFinancial analysis concept featuring a magnifying glass over business charts demonstrating growth and increasing profits visualization. - Powered by Adobe

Credit Photo

If you would like to credit the Photo, here are some ways you can do so

Free (free of charge)

Free for personal and commercial use.

Author: Creative Art

Similar Free Stock Images

Dynamic Financial Data Display with Stock Market Tickers
Premium
data analysis search engine optimization or seo magnifier charts graphs ultraviolet and neon screen ai generative
Abstract Financial Growth Bar Charts with Data Overlay
Abstract Financial Data Analysis with Graphs and Numbers
Financial Data Analysis with Seamless Bar Graph Interface
Global Data Processing and Statistics Visualization Concept
Premium
Young Woman Analyzing Financial Data On Computer
Dynamic Display of Stock Market Data Analytics
Dynamic Stock Market Financial Data Visualization
Stock Market Data Visualization on Digital Screen
Dynamic Stock Market Screen with Digital Data Display
Premium
Business finance data analytics graph.Financial management technology.Advisor using KPI Dashboard on virtual screen.
Financial Data on Digital Screen Displaying Stock Market Changes
Global Data Processing and Business Analytics Screen
Financial Data Overlay on Night Cityscape Urban Fusion Concept
Global Financial Data and Statistical Analysis Stream
Premium
A diverse group of hands collaborates to assemble puzzle pieces, symbolizing teamwork and data analysis in a professional setting, emphasizing innovative insights. Amity
Dynamic Financial Data on Glowing Digital Screen
Global Stock Market Data and Economic Analysis on World Map
Abstract Financial Data Visualization on Reflective Surface
Abstract Financial Data over Cityscape Concept Background
Premium

Dynamic blue and green digital stock market graph with bar charts and lines on a dark background, representing financial data analysis, investment trends, business growth, and global economy fluctuat
Data Processing on Digital Grid Background with Code Display
Global Financial Data Processing with World Map Overlay
Financial Data Visualization with Bar Charts Overlaid on Digital Grid
Financial Data Projections on Dark Background Showing Stock Trends
Premium
Financial data document graph chart report statistic marketing research development  planning management strategy analysis accounting. Financial business technology hologram concept. 3d rendering.
Abstract View of Stock Market Graph Overlaying Skyscraper
Digital Dashboard with Dynamic Data Visualizations and Binary Code
Technology-Driven Digital Analysis Chart with Globe Overlay
Data Center Reflection with Code Overlay and LED Indicators
Bitcoin Symbol Against Global Financial Data Background
Black Digital Screen with Business Graphs and Data Interface
Premium
Marketing team analyzing data on laptop and pointing at screen during meeting
Digital Financial Data Panels in Monochrome Style
Financial Data Processing Over Urban Skyscraper
City Skyline Merged with Financial Data Analytics Concept
Monochromatic Financial Data and Chart Analysis
Premium
Office interior with graphs and diagrams
Digital Financial Data Display with Global Focus
Dynamic Stock Market Charts with Financial Data
Dynamic Stock Market Data Display with Digital Graph
Abstract Stock Market Data with Financial Graphs and Charts
Premium
Business audit stock financial finance management on analysis data strategy with graph accounting marketing or report chart economy investment research profit concept
Digital Stock Market Data Displaying Financial Trends
Stock Market Data with Global Map Overlay
Digital Data Trends Overlaying Cityscape Indicating Business Growth
Digital Stock Market Data Visualization in Blue
Premium
Hand holding a magnifying glass over a stock market chart- analyzing fluctuating trends and data for investment insights and financial growth.
Digital Data and Stock Market Display Background
Financial Data Overlapping Agricultural Field for Global Business
Digital Graphs and Statistics Interface on Blue Grid
Digital Stock Market Graph with Data in Blue
Premium
Two businessmen are together analyzing the financial data graph and pointing to the laptop computer screen.
Digital Data Processing with Global Networks Background
Global Financial Data Concept with Digital World Map Overlay
Blurred Stock Market Display Overlapping City Skyline
Digital Globe with Financial Data Stream Symbolizing Global Connectivity
Premium
Business audit stock financial finance management on analysis data strategy with graph accounting marketing or report chart economy investment research profit concept
Blending Architecture and Analytics at Urban Construction Site
Composite Visualization of Renewable Energy Site Analytics and Charts
Cityscape Infused with Financial Data Charts and Graphs
Digital Data Streams over Cloud Background
Dynamic Digital Diagrams on Futuristic Interface Background
Digital Bar Graph With Data Overlay on White Background
Premium
Abstract glowing big data forex candlestick chart on blurry city backdrop. Trade, technology, investment and analysis concept
Financial Data Analysis Overlaying Urban Cityscape
Global Finance and Data Visualization Interface Background
Abstract Financial Chart with Pie and Bar Graphs on White Background
Digital Stock Market Data and Statistical Analysis Background
Premium
Analyst working in Business Analytics and Data Management System to make report with KPI and metrics connected to database. Corporate strategy for finance, operations, sales, marketing.
Dynamic Stock Market Data Display with Charts and Numbers
Digital Display Showing Stock Market Values and Data Analytics
Data Analytics and Stock Market Trends on Digital Display
Animated Stock Market Ticker Displaying Financial Data
Premium
A businesswoman analyzes financial documents with charts and graphs at a desk, highlighting data trends with a pen in a bright, professional office setting.
Digital Data Display with Stock Market Information Grid
Digital Financial Data with Graphical Analysis Overlay
Analyzing Global Stock Market Data with Digital Interface
Global Financial Data on Digital Web Display
Premium
Data analysis science and big data with AI technology. Analyst or Scientist uses a computer and dashboard for analysis of information on complex data sets on computer. Insights development engineer
Financial Data Across Abstract World Map for Global Business
Digital Financial Data Processing on Dark Background
Abstract Data Interface with Cityscape Background
Stock Market Data Overlay with Businesswoman in Background
Premium
Hands, laptop and chart with paper for business man, analysis or check progress of economy, investment or profit. Financial agent, pc and reading graph for data document, growth or numbers for future
Financial Data Analysis with Graphs and Charts
Financial Data Analysis with Graphs and Statistics Overlay
Abstract Digital Data Network with Graphs and Bar Charts
Digital Data Graphs with Cloudy Background for Business Intelligence
Premium
Conference Business Meeting Presentation: CEO Businessman Shows Data to Group of Investors, Businessspeople. Projector Screen Shows Graphs, Product Sales, Revenue Growth Strategy, e-Commerce Analysis
Futuristic Data Dashboard: Code, Charts, and Analytics Visualization
Sunset horizon glowing over rural landscape overlaying financial charts and timeline data
Abstract Digital Data Visualization and Analytics Concept
Data Analysis Concepts with Bar Diagrams and Graphs
Statistical Data Analysis with Bar Charts and Graphs
Data Visualization with Bar Graph and Dark Interface
Premium
Artificial Intelligence in Document Analysis, the role of artificial intelligence in document analysis with an image portraying machine learning algorithms extracting data from unstructured documents
Digital Financial Data Over Dynamic Grid Background
Business Data Analysis Fintech Statistics Charts
Stock Market Analysis with Financial Data Indicators
Financial Data Overlaying World Map in Digital Interface
Premium
Large screen display showing various business graphs and charts.
Digital World Map with Global Financial Technology
Dynamic Stock Market Analytics with High-Tech Data Visualization
Digital Financial Data Display with Stock Market Information
Dynamic Finance Digital Display Showing Stock Market Trends
Premium
business statistics info graphics, pie charts, bar graphs, and numerical data, business growth analysis
Financial Data Overlay on Server Infrastructure with Digital Interface
Financial Data Superimposed on Football Action
Financial Data Visualization with Team Collaboration in Modern Office
Financial Data Overlay on Modern Office Workspace
Premium
Data science and big data technology. Data scientist computing, analysing and visualizing complex data set on computer. Data mining, artificial intelligence, machine learning, business analytics.
Dynamic Stock Market Data with Digital Interface Concept
Binary Code with Financial Charts and Data Analysis
Digital Data Processing with Growing Follower Count
Digital Representation of Global Financial Markets and Data Processing
Premium
Presentation, whiteboard and businessman with finance strategy, erp marketing analysis and company kpi review. Accountant black man with chart, graph or financial statistics for corporate budget data
Abstract Digital Interface with Financial Data Processing Graphics
Digital Interface with Stock Market Overlay on Cityscape Background
Futuristic Data Visualization Over Urban Skyline at Dusk
Displaying Graphics and Charts on Office Projector Screen
Premium
Stock market and trading, digital graph
Inspecting Rooftop Worker Holding Plans on Stair Platform with Data and Chart Overlay