
- Home >
- Stock Photos >
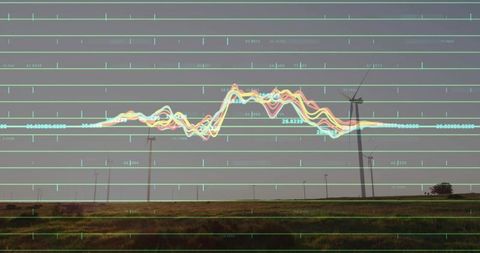
- Abstract Data Wave Patterns on Technology Interface
Abstract Data Wave Patterns on Technology Interface Image

Dynamic flow patterns chart move on black background, representing concepts in technology and digital innovation. Ideal for presentations on big data trends, technology interfaces, network systems, and data analysis tools. Use in technology-focused reports, social media graphics, or interactive guides showcasing digital growth.
Powered by  - Get 15% off with code: PIKWIZARD15


downloads
Tags:
More
Credit Photo
If you would like to credit the Photo, here are some ways you can do so
Text Link
photo Link
<span class="text-link">
<span>
<a target="_blank" href=https://pikwizard.com/photo/abstract-data-wave-patterns-on-technology-interface/efdd446cd7b802852b6da5959bf92c89/>PikWizard</a>
</span>
</span>
<span class="image-link">
<span
style="margin: 0 0 20px 0; display: inline-block; vertical-align: middle; width: 100%;"
>
<a
target="_blank"
href="https://pikwizard.com/photo/abstract-data-wave-patterns-on-technology-interface/efdd446cd7b802852b6da5959bf92c89/"
style="text-decoration: none; font-size: 10px; margin: 0;"
>
<img src="https://pikwizard.com/pw/medium/efdd446cd7b802852b6da5959bf92c89.jpg" style="margin: 0; width: 100%;" alt="" />
<p style="font-size: 12px; margin: 0;">PikWizard</p>
</a>
</span>
</span>
Free (free of charge)
Free for personal and commercial use.
Author: Creative Art
Similar Free Stock Images

Premium


Premium

Premium


Premium


Premium


Premium


Premium


Premium


Premium

Premium

Premium

Premium


Premium


Premium


Premium


Premium


Premium


Premium


Premium


Premium


Premium

Premium


Premium


Premium


Premium


Explore More Free Stock Images