- Home >
- Stock Photos >
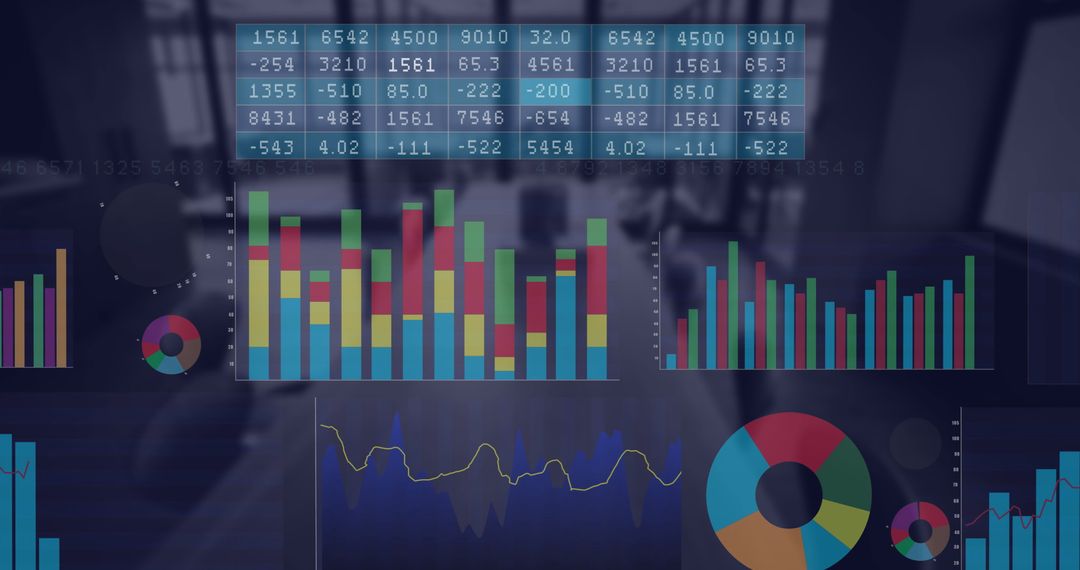
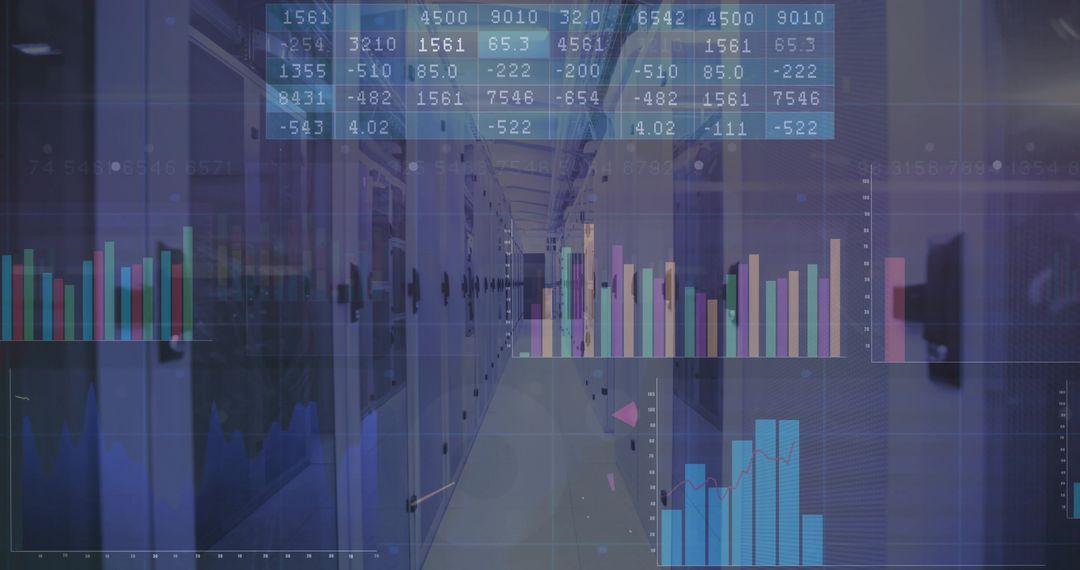
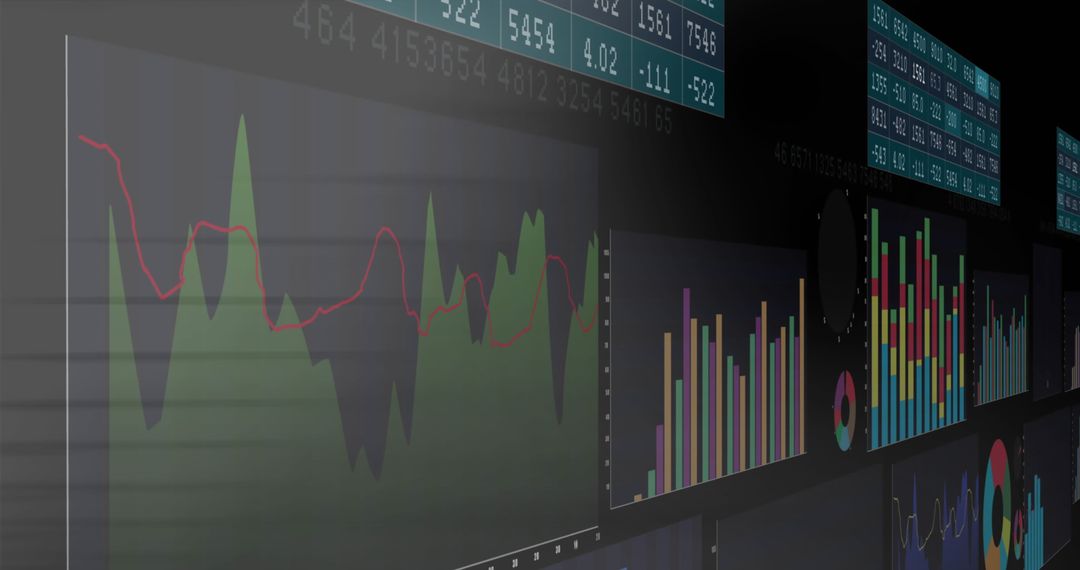
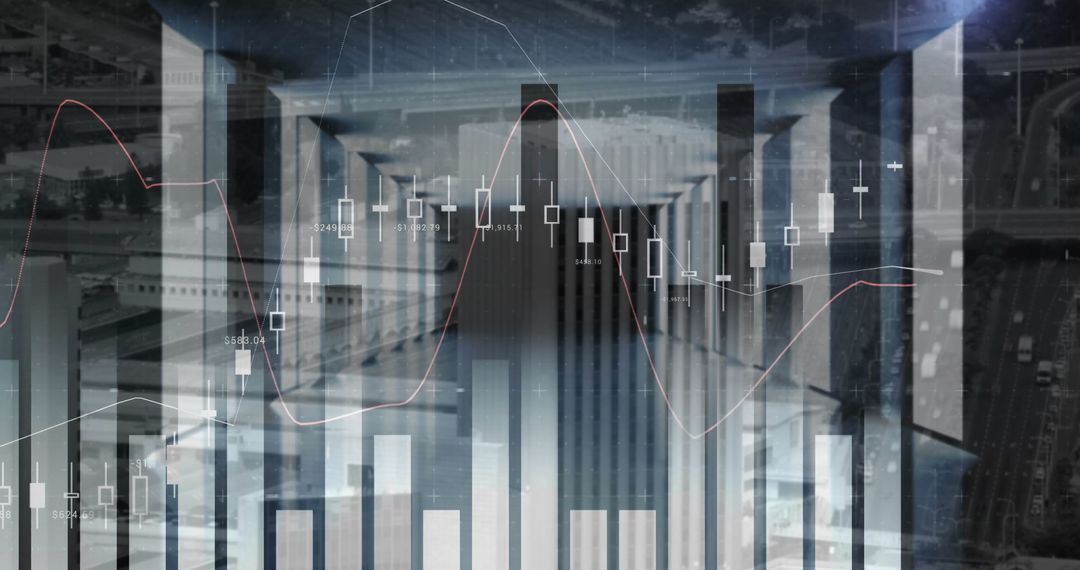
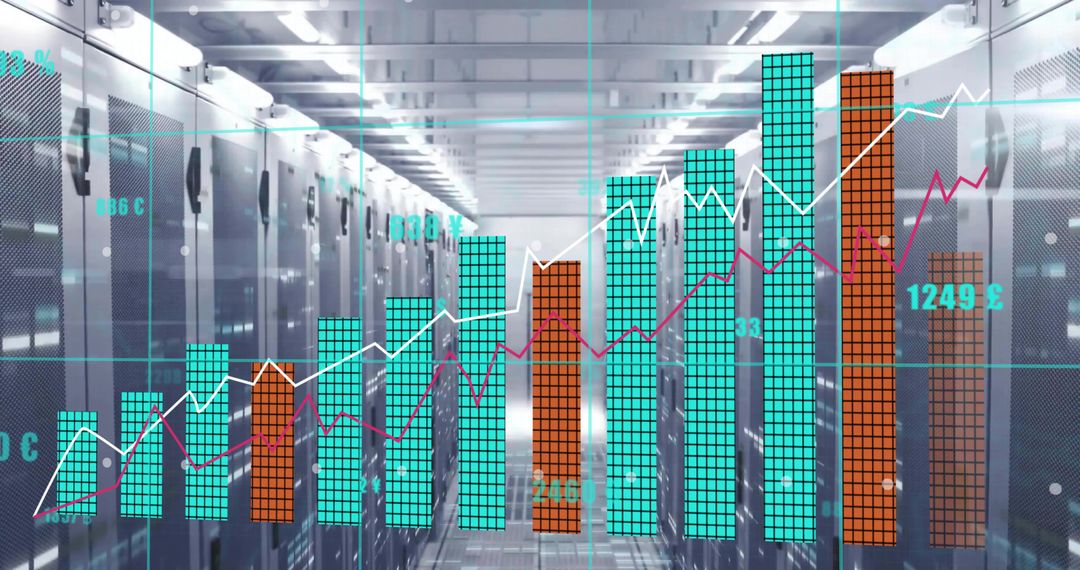
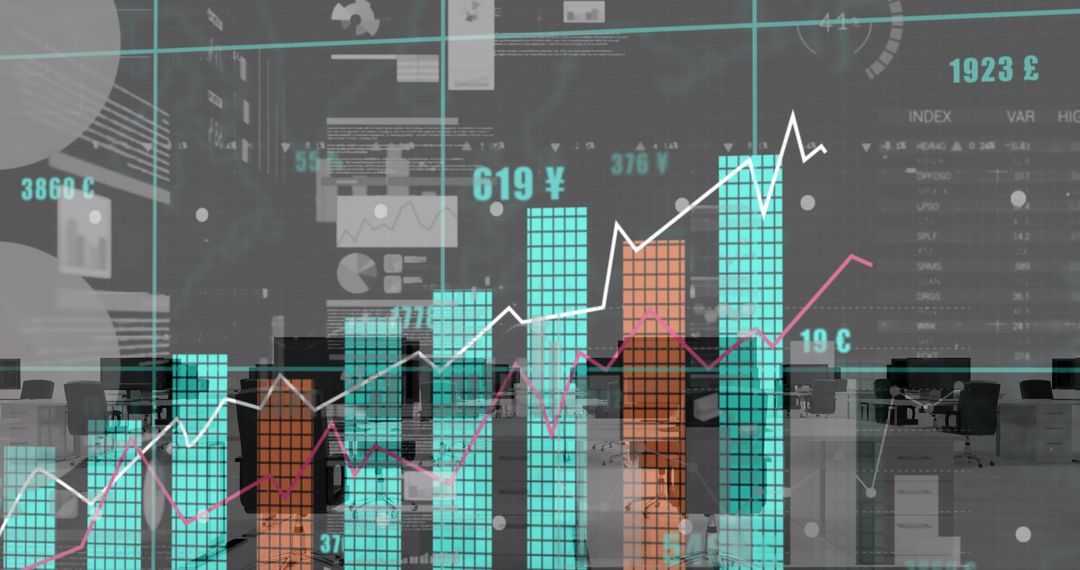
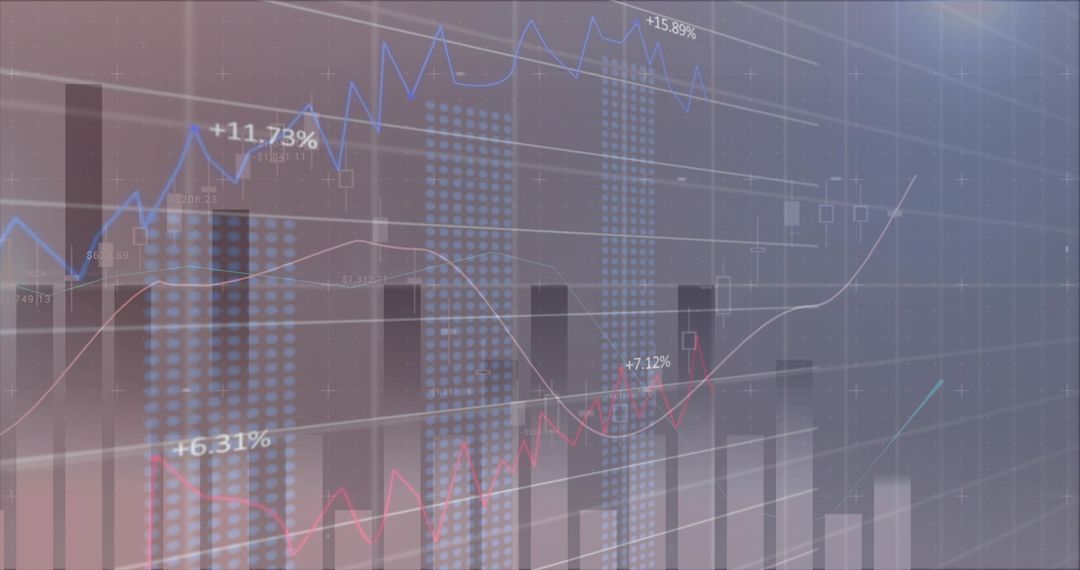
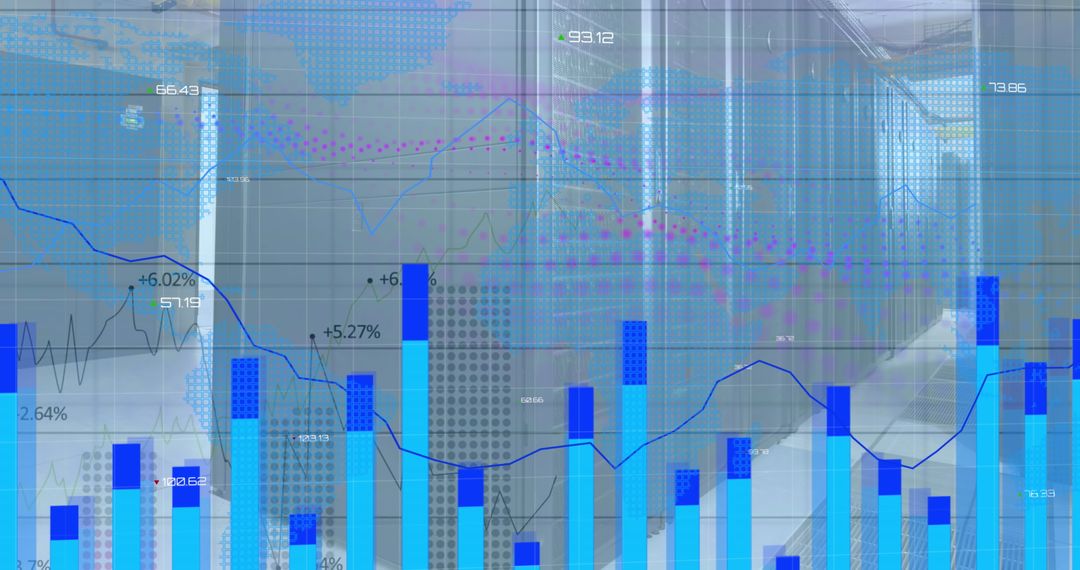
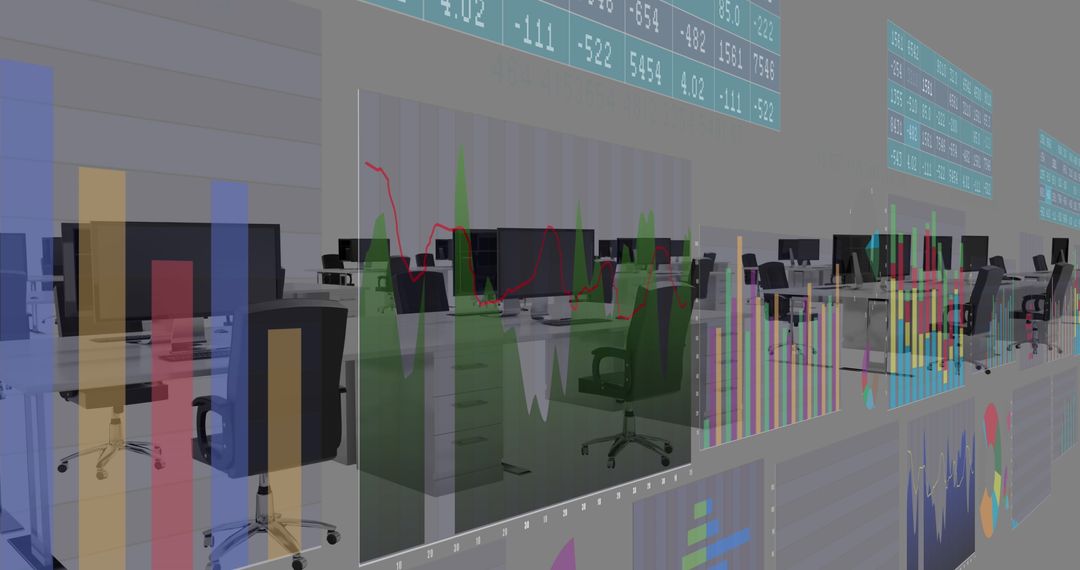
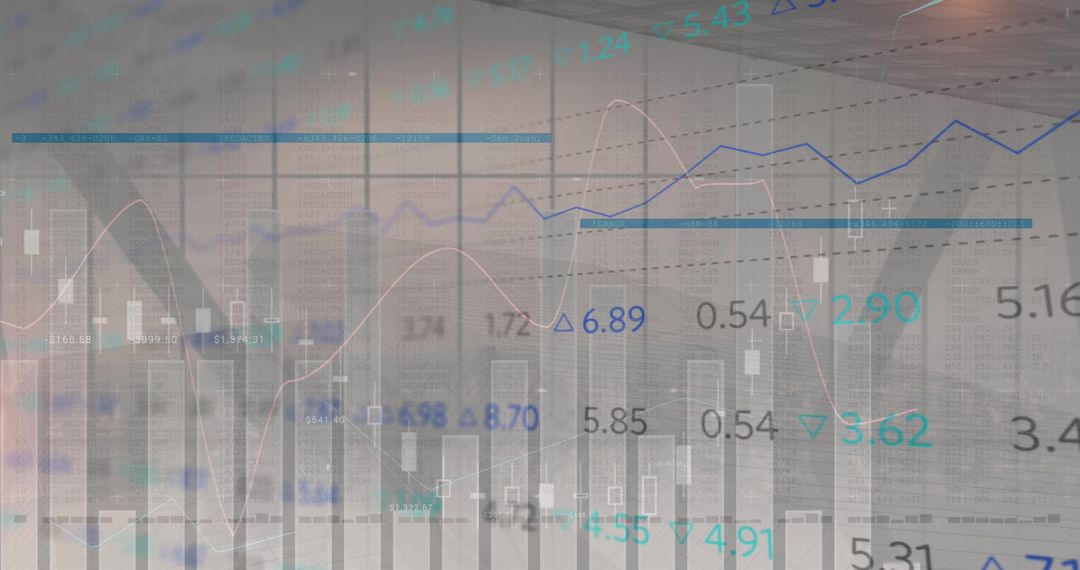
- Abstract Digital Business Finance Graphs and Server Room Interface
Abstract Digital Business Finance Graphs and Server Room Interface Image

Overlay of abstract data graphs and digital interfaces with a blurry server room backdrop captures the evolution of technology in finance and business sectors. Useful for illustrating digital communication, financial data analysis, and modern technology trends. Ideal for presentations, websites focused on financial analytics, or tech industries showcasing data management solutions.
Powered by  - Get 15% off with code: PIKWIZARD15


0
downloads
downloads
Tags:
More
Credit Photo
If you would like to credit the Photo, here are some ways you can do so
Text Link
photo Link
<span class="text-link">
<span>
<a target="_blank" href=https://pikwizard.com/photo/abstract-digital-business-finance-graphs-and-server-room-interface/5bc1bbd06ed84829e79ee269314219bd/>PikWizard</a>
</span>
</span>
<span class="image-link">
<span
style="margin: 0 0 20px 0; display: inline-block; vertical-align: middle; width: 100%;"
>
<a
target="_blank"
href="https://pikwizard.com/photo/abstract-digital-business-finance-graphs-and-server-room-interface/5bc1bbd06ed84829e79ee269314219bd/"
style="text-decoration: none; font-size: 10px; margin: 0;"
>
<img src="https://pikwizard.com/pw/medium/5bc1bbd06ed84829e79ee269314219bd.jpg" style="margin: 0; width: 100%;" alt="" />
<p style="font-size: 12px; margin: 0;">PikWizard</p>
</a>
</span>
</span>
Free (free of charge)
Free for personal and commercial use.
Author: Creative Art
Similar Free Stock Images

Premium


Premium


Premium


Premium


Premium


Premium


Premium


Premium


Premium


Premium


Premium


Premium


Premium


Premium


Premium


Premium


Premium


Premium


Premium


Premium


Premium


Premium


Premium


Premium