- Home >
- Stock Photos >
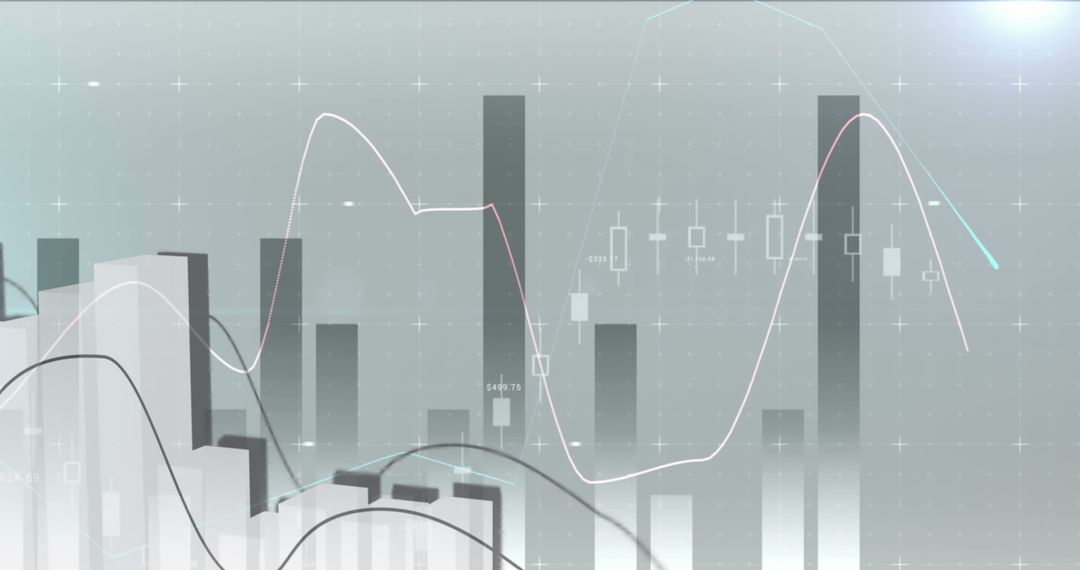
- Abstract Digital Chart in Futuristic Financial Analysis Concept
Abstract Digital Chart in Futuristic Financial Analysis Concept Image

Abstract digital chart representing financial data analysis. Can be used for educational purposes, presentations on financial trends, or website banners related to stock market dynamics and economic strategies.
Powered by  - Get 15% off with code: PIKWIZARD15


5
downloads
downloads
Tags:
More
Credit Photo
If you would like to credit the Photo, here are some ways you can do so
Text Link
photo Link
<span class="text-link">
<span>
<a target="_blank" href=https://pikwizard.com/photo/abstract-digital-chart-in-futuristic-financial-analysis-concept/cc12b0ca9e6cf2763ee77f3ec9f10bc9/>PikWizard</a>
</span>
</span>
<span class="image-link">
<span
style="margin: 0 0 20px 0; display: inline-block; vertical-align: middle; width: 100%;"
>
<a
target="_blank"
href="https://pikwizard.com/photo/abstract-digital-chart-in-futuristic-financial-analysis-concept/cc12b0ca9e6cf2763ee77f3ec9f10bc9/"
style="text-decoration: none; font-size: 10px; margin: 0;"
>
<img src="https://pikwizard.com/pw/medium/cc12b0ca9e6cf2763ee77f3ec9f10bc9.jpg" style="margin: 0; width: 100%;" alt="" />
<p style="font-size: 12px; margin: 0;">PikWizard</p>
</a>
</span>
</span>
Free (free of charge)
Free for personal and commercial use.
Author: Creative Art
Similar Free Stock Images

Premium


Premium


Premium


Premium


Premium


Premium


Premium


Premium


Premium


Premium


Premium


Premium


Premium


Premium


Premium


Premium


Premium


Premium


Premium


Premium


Premium


Premium


Premium


Premium