- Home >
- Stock Photos >
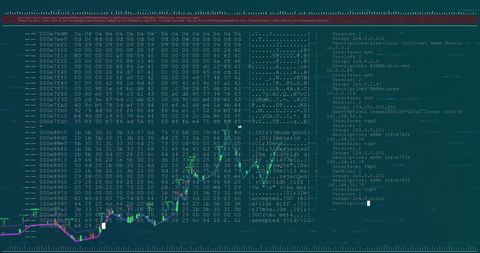
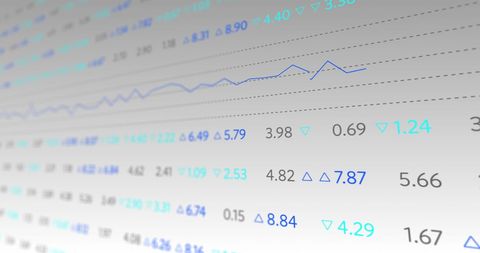
- Abstract Digital Chart with Financial Data Lines
Abstract Digital Chart with Financial Data Lines Image

Abstract depiction of financial data, illustrating lines and numbers on black background. Ideal for illustrating financial reports, market analysis, or business-related presentations focused on macroeconomic trends and digital investments. Use in settings related to finance, business, data science, or technology.

downloads
Tags:
More
Credit Photo
If you would like to credit the Photo, here are some ways you can do so
Text Link
photo Link
<span class="text-link">
<span>
<a target="_blank" href=https://pikwizard.com/photo/abstract-digital-chart-with-financial-data-lines/5e40a3edad394818d668060c114bcd55/>PikWizard</a>
</span>
</span>
<span class="image-link">
<span
style="margin: 0 0 20px 0; display: inline-block; vertical-align: middle; width: 100%;"
>
<a
target="_blank"
href="https://pikwizard.com/photo/abstract-digital-chart-with-financial-data-lines/5e40a3edad394818d668060c114bcd55/"
style="text-decoration: none; font-size: 10px; margin: 0;"
>
<img src="https://pikwizard.com/pw/medium/5e40a3edad394818d668060c114bcd55.jpg" style="margin: 0; width: 100%;" alt="" />
<p style="font-size: 12px; margin: 0;">PikWizard</p>
</a>
</span>
</span>
Free (free of charge)
Free for personal and commercial use.
Author: Authentic Images