
- Home >
- Stock Photos >
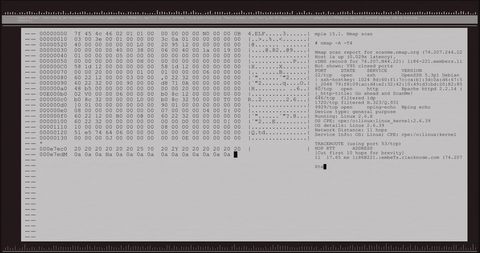
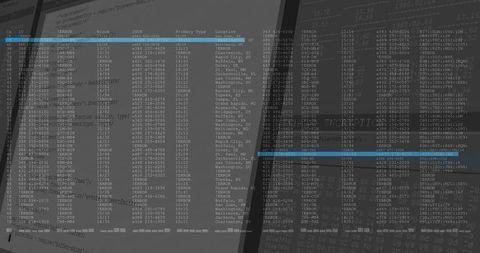
- Abstract Digital Dashboard with Alphanumeric Codes and Error Strings
Abstract Digital Dashboard with Alphanumeric Codes and Error Strings Image

This depiction is ideal for stories about cybersecurity issues, digital technology discussions, or futuristic interface concepts. With an emphasis on errors and data representation, it suits tech presentations, infographics, and articles on innovation.
Powered by  - Get 15% off with code: PIKWIZARD15


downloads
Tags:
More
Credit Photo
If you would like to credit the Photo, here are some ways you can do so
Text Link
photo Link
<span class="text-link">
<span>
<a target="_blank" href=https://pikwizard.com/photo/abstract-digital-dashboard-with-alphanumeric-codes-and-error-strings/30437fa73f54da4ea54ba17413d0871b/>PikWizard</a>
</span>
</span>
<span class="image-link">
<span
style="margin: 0 0 20px 0; display: inline-block; vertical-align: middle; width: 100%;"
>
<a
target="_blank"
href="https://pikwizard.com/photo/abstract-digital-dashboard-with-alphanumeric-codes-and-error-strings/30437fa73f54da4ea54ba17413d0871b/"
style="text-decoration: none; font-size: 10px; margin: 0;"
>
<img src="https://pikwizard.com/pw/medium/30437fa73f54da4ea54ba17413d0871b.jpg" style="margin: 0; width: 100%;" alt="" />
<p style="font-size: 12px; margin: 0;">PikWizard</p>
</a>
</span>
</span>
Free (free of charge)
Free for personal and commercial use.
Author: Authentic Images
Similar Free Stock Images

Premium


Premium


Premium


Premium


Premium

Premium


Premium


Premium


Premium


Premium


Premium


Premium


Premium

Premium


Premium


Premium

Premium


Premium


Premium


Premium

Premium


Premium


Premium


Premium


Premium


Explore More Free Stock Images