1. Home > 
  2. Stock Photos > 
  3. Abstract Digital Dashboard with Green Graph

Abstract Digital Dashboard with Green Graph Image

Abstract Digital Dashboard with Green Graph

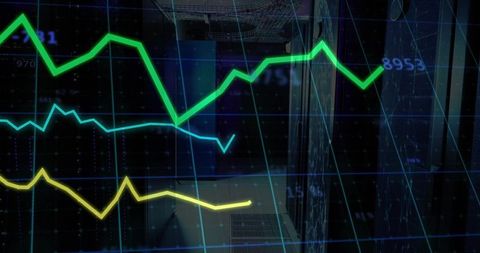
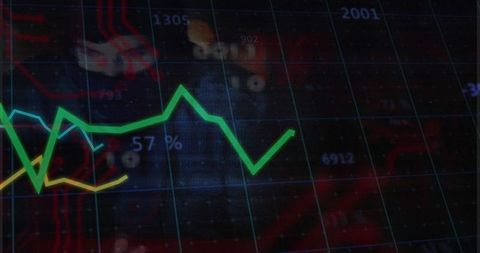
An abstract visualization displays a fluctuating green line graph over a grid on a digital dashboard, enriched by a radar element. Suitable for projects involving financial technology, futuristic data analytics, or innovative interface design. Ideal for use in presentations and discussions related to stock market trends, technological advancements, or applications of modern data analysis.

Powered by Shutterstock logo - Get 15% off with code: PIKWIZARD15
Displaying green line chart trending upward on financial dashboard with numeric and code overlays. Technology, analytics, data, visualization, digital, finance, innovation - Powered by Shutterstock - Get 15% off with code: PIKWIZARD15Displaying green data dashboard showing bar charts, neon line graph, numeric readouts on screen. Futuristic, digital, technology, analytics, network, interface, neon - Powered by Shutterstock - Get 15% off with code: PIKWIZARD15Displaying green waveform pulsing on display, with gridlines, labels, trend line and world map HUD. Analytics, technology, futuristic, digital, dashboard, interface, innovation - Powered by Shutterstock - Get 15% off with code: PIKWIZARD15Displaying neon-blue circular nodes forming columns on futuristic interface, with white data panels. Technology, data visualization, digital interface, futuristic, analytics, network, innovation - Powered by Shutterstock - Get 15% off with code: PIKWIZARD15Displaying data dashboard overlay on digital interface, with pie and donut charts plus data table. Analytics, visualization, technology, interface, insight, data, dashboard - Powered by Shutterstock - Get 15% off with code: PIKWIZARD15

Credit Photo

If you would like to credit the Photo, here are some ways you can do so

Free (free of charge)

Free for personal and commercial use.

Author: Authentic Images

Similar Free Stock Images

Futuristic Data Analysis Overlaying Cityscape Digital Interface
Premium
Businessman Interacting with Sustainable Technology Dashboard
Global Finance and Data Analytics in Server Environment
Financial Analysis Overlay on Diverse Business Team in Office Meeting
Premium
Displaying dashboard in futuristic control panel with gauge, charts, world map and candlesticks. Technology, analytics, visualization, innovation, interface, digital, data
Abstract Financial Data Analysis with Dynamic Graphs on Green
Graphical Data Analysis on Digital Interface
Dynamic Financial Data Processing Showing Stock Market Interface
Pulsing Green Digital Waveform with Futuristic Analytics Display
Premium
Blue map showing red and green candlestick bars in trading dashboard, with turquoise trend line. Geographical, analytics, visualization, data, finance, technology, dashboard
Green Line Graph Trending on Digital Interface with Data Analytics Elements
Data Center Technician Monitoring Network Performance on Laptop with Racks, Cables and Analytics Ove
Digital Financial Market Chart Visualization on Trading Screen
Line Graph Data Analytics Overlaid on Server Room Digital Grid
Premium
Displaying eight vertical bars alternating white tops and blue bases on dashboard, with world map. Data visualization, analytics, dashboard, technology, digital interface, performance, insights
Global Stock Market Analysis with Digital Interface Over World Map
Financial Data and Technology Integration in Business Network
IT Technician Analyzing Server Rack with Data Overlay
Global Business Data and Digital Interface Concept
Premium
Standing executive wearing suit at dashboard showing green bar and line graphs with circuit icons. Technology, finance, data, analytics, innovation, cybersecurity, corporate
Dynamic Stock Market Data Amid Empty Office Setting
Financial Data Overlaid on City Skyline
Digital Data Processing with Line Graph Overlay in Server Room
Digital Financial Data Visualization Against World Map
Premium
Displaying white bar chart on grid with green code patterns, featuring glowing line graph, HUD. Technology, data, analytics, futurism, visualization, interface, digital
Dynamic Data Charts on Geometric Abstract Background
Global Data Visualization with Interactive World Map, Financial Charts and Analytics Dashboard
Digital Interface Showing Rising Stock Market Trends
Premium
Displaying green upward arrow and gauge on digital dashboard with candlesticks and magenta graph. Financial, technology, data, analytics, investment, futuristic, digital
Rising Green Financial Line Graph with Data Annotations
Futuristic Data Analytics Dashboard with Bar and Trend Charts
Financial Data Processing in Modern Office Environment
Futuristic Green Pound Symbol Amid Financial Data Charts
Abstract Data Visualization with Retro Future Digital Interface
Futuristic Digital Interface with Dynamic Financial Graph
Dynamic Stock Market Graphs Show Financial Analytics and Trends
Futuristic Globe with Digital Green Line Chart in Motion
Premium
Displaying green hexagon icons and charts on virtual dashboard, with CO₂ and economic arrow. Technology, data visualization, analytics, sustainability, finance, innovation, digital interface
Premium
Spinning wireframe globe displaying nodes in digital dashboard, with pie charts and percent labels. Data analytics, futuristic, digital interface, visualization, technology, network, intelligence
Premium
Displaying data dashboard panel at virtual control room, with triangular charts and ring gauge. Technology, data visualization, analytics, digital, futuristic, dashboard, interface
Global Financial Data and Statistics Over World Map
Rising Financial Data Highlights Global Economic Growth
Dynamic Financial Data with Overlaid Cityscape Interface
Data Processing Visualization on Digital World Map Interface
Digital Network Connections and Financial Data Analysis
Digital Finance Graph with Data Points on Dark Background
Healthcare Professional Analyzing Medical Data with Trends
Futuristic Technological Finance Data with Digital Analysis Grid
Premium
Environmental data and statistics image over digital interface with various icons. Technology, analytics, eco-friendly, sustainability, visualization, dashboard
Futuristic Technology Dashboard with Data Graph and Encryption Interface
Digital Financial Data Trends and Analytics Conceptual Background
Colorful Financial Chart Representing Stock Market Trends
Global Financial Data Trading Analytics Over Flames Concept
Premium
Two 3D pie charts floating in analytics dashboard, with percentage labels and dotted trend line. Data visualization, dashboard, digital interface, future technology, information analysis, abstract
Dynamic Stock Market Data Visualization with Turquoise Line Chart
Business Professionals Analyzing Financial Data on Laptops
Digital Trading Interface with Red Fluctuating Line Graph
Futuristic Digital Dashboard Displaying Rising Trend Lines CG Model
Business Professionals Analyzing Graphs in Modern Conference Room
Colorful Data Line Graphs on Digital Circuit Interface
Abstract Network Visualization with Woman's Profile and Digital Data
Analyzing Financial Data in a Business Technology Office
Premium
Green pixelated shield with padlock icon securing data in dashboard, with bar charts and streams. Cybersecurity, data protection, digital interface, network security, futuristic, analytics, technology
Data Analytics and Business Strategy Network Interface
Financial Data Processing Over Global Map
Premium
Waveform graph fluctuating on dashboard screen, with grid lines, globe and numeric labels. Data visualization, dashboard, digital interface, analytics, technology, futuristic, information
Premium
Displaying holographic control room interface with two pie charts, numeric hub and scrolling panels. Technology, analytics, data, futuristic, digital, innovation, interface
Futuristic Data Analytics Dashboard with 3D Graph Visualization
Global Stock Market Data Flow with Digital Interface
Financial Trends Overlaid on Office Desks with Data Points
Financial Data Processing with Global Business Analytics
Data Analytics Dashboard Displaying Growth Indicators
Rising Graphs Over Cityscape Illustrating Financial Growth
Financial Data and Stock Market Trends Overlaying Cityscape
Green Energy Investment Trends Displayed in Dynamic Graph Overlay
Premium
Displaying dashboard showing centered gauge on dark grid, with side gauge metrics arrows and graph. Technology, analytics, data visualization, interface, futuristic, digital, innovation
Premium
Displaying data dashboard on computer screen, with code, bar chart and line graph and grid overlay. Technology, analytics, dashboards, data, information, visualization, finance
Abstract Data Visualization with Digital Interface Overlays
Digital Analytics Dashboard with Graph and Map in Futuristic Style
Financial Data Analysis and Technological Interface at Office
Futuristic Neon Line Graph on Virtual Analytics Dashboard
Premium
Displaying data dashboard on dark screen, with world map, pie charts, metrics and bar chart overlay. Technology, analytics, visualization, neon, interface, enterprise, innovation
Futuristic Data Visualization with Interactive Line Graph and World Maps
Financial Data with Trends and Arrows Over Cityscape
Futuristic Data Dashboard with Colorful Line Graphs
Futuristic Digital Dashboard with Neon Line Charts Analysis
Premium
Displaying trading dashboard on screen at desk, with candlestick bars, trend line, HUD timestamps. Finance, data visualization, dashboard, analytics, technology, investment, screen
Financial Data Visualization and Digital Analysis Concept
Dynamic Financial Graph Analyzing Market Trends
Financial Data Technology with Digital Interface Graphs
Premium
Showing translucent wireframe graph at 38.67% with bar chart on interface, binary code and tickers. Analytics, technology, data, visualization, finance, digital, dashboard
Rising Red Line Graph with Stock Market Candlesticks Overlay
Global Financial Data and Analytics Overlay
Futuristic Digital Interface with Upward Trend Graph and C++ Code
Dynamic Financial Data Analyzing with Graph Overlays
Colleagues Analyzing Business Metrics with Digital Charts
Futuristic finance dashboard overlaying datacenter racks with neon charts and metrics
Digital Interface Finance Overlay With World Map and Chart Graphics
Financial Growth Chart Overlay on City Skyline
Digital Data Analysis on World Map Grid with Global Connectivity
Digital trading screen with rising charts and data analytics
Global Data Analytics and Stock Market Visual Interface
Abstract Financial Data Visualization with Multicolored Graphs
Financial Growth Data Overlay on Urban Skyline
Remote Work Communication and Digital Finance Concept
Premium
Showing bar charts red-and-green line graphs on circuit grid on screen with waveform map code panel. Technology, data, analytics, visualization, digital, dashboard, futuristic
Green Digital Currency Analysis and Growth Trends
Abstract Financial Data Analysis and Global Business Concept
Abstract Financial Data Analysis with Digital Figures
Green Line Graph Over Urban Skyline Data Visualization
Premium
Displaying digital dashboard on dark grid background with line graph, gauges, financial index table. Technology, analytics, futuristic, interface, dashboard, innovation, visualization
Data Center Corridor with Floating Financial Graph
Financial Graphs Over Urban Cityscape Illustrating Dynamic Markets
Financial Data Visualization in Server Room Setting
Neon Green Line Graph Over Urban Night Skyline
Premium
Displaying digital dashboard overlay above laptop on desk in office, with holographic data panels. Futuristic, technology, innovation, analytics, digital, interface, corporate
Global Financial Data Overlaid on Cloudy Sky Emphasizing Energy Sector
Financial Data Visualization with Mobile Payment Concept
Fluctuating Green Line Chart on Digital Futuristic Dashboard
Global Business Data Visualization with Cityscape and World Map
Premium
Businessman analyzing carbon footprint reduction with a futuristic dashboard. Concept of sustainability, renewable energy, CO2 emissions management, and environmental responsibility in business.
Abstract Stock Market Data with Growing Graph
Futuristic Data Analysis in Finance Concept with Rising Graph
Premium
Displaying white-outlined panel showing neon green spikes on grid backdrop, with numeric overlays. Technology, data visualization, analytics, digital interface, financial, neon, futuristic
Dynamic Financial Analysis on Digital Trading Screen
Explore More Free Stock Images