- Home >
- Stock Photos >
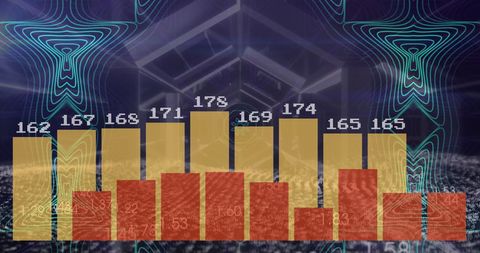
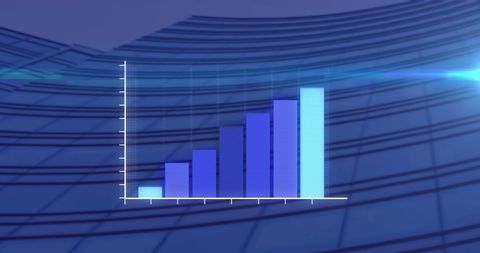
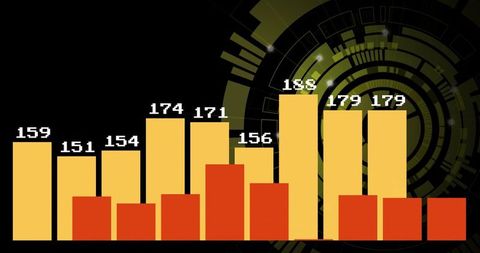
- Abstract Digital Data Analysis Concept Background
Abstract Digital Data Analysis Concept Background Image

Abstract image showing digital data processing with overlapping fingerprint patterns and numeric data overlaid on colored bars. Ideal for presenting technology-related concepts in programming, data analysis, or cybersecurity themes. Great for mathematics and statistics topics in education, presentations, or digital media platforms.

downloads
Tags:
More
Credit Photo
If you would like to credit the Photo, here are some ways you can do so
Text Link
photo Link
<span class="text-link">
<span>
<a target="_blank" href=https://pikwizard.com/photo/abstract-digital-data-analysis-concept-background/d519fed480a97b00d291be14a534fd56/>PikWizard</a>
</span>
</span>
<span class="image-link">
<span
style="margin: 0 0 20px 0; display: inline-block; vertical-align: middle; width: 100%;"
>
<a
target="_blank"
href="https://pikwizard.com/photo/abstract-digital-data-analysis-concept-background/d519fed480a97b00d291be14a534fd56/"
style="text-decoration: none; font-size: 10px; margin: 0;"
>
<img src="https://pikwizard.com/pw/medium/d519fed480a97b00d291be14a534fd56.jpg" style="margin: 0; width: 100%;" alt="" />
<p style="font-size: 12px; margin: 0;">PikWizard</p>
</a>
</span>
</span>
Free (free of charge)
Free for personal and commercial use.
Author: Awesome Content