
- Home >
- Stock Photos >
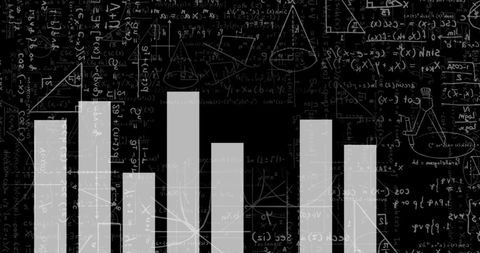
- Abstract Digital Data Analysis with Graphs and Equations
Abstract Digital Data Analysis with Graphs and Equations Image
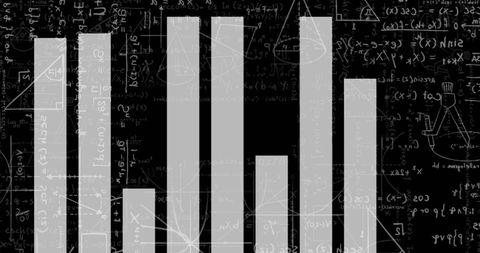
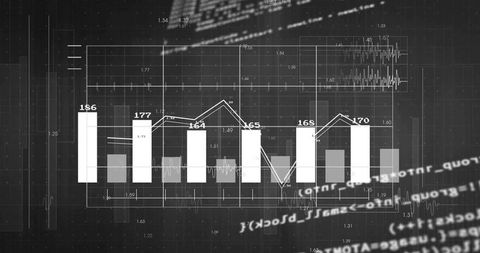
Background featuring vertical bar charts overlaying a blackboard filled with equations. Ideal for illustrating concepts in financial data analysis, mathematics, and technology-driven business solutions. Suitable for use in educational materials, business presentations, or technology-oriented publications to convey complex analytical themes.
Powered by 


downloads
Tags:
More
Credit Photo
If you would like to credit the Photo, here are some ways you can do so
Text Link
photo Link
<span class="text-link">
<span>
<a target="_blank" href=https://pikwizard.com/photo/abstract-digital-data-analysis-with-graphs-and-equations/d234adf98dc1ffe1ae019e9124e7cb76/>PikWizard</a>
</span>
</span>
<span class="image-link">
<span
style="margin: 0 0 20px 0; display: inline-block; vertical-align: middle; width: 100%;"
>
<a
target="_blank"
href="https://pikwizard.com/photo/abstract-digital-data-analysis-with-graphs-and-equations/d234adf98dc1ffe1ae019e9124e7cb76/"
style="text-decoration: none; font-size: 10px; margin: 0;"
>
<img src="https://pikwizard.com/pw/medium/d234adf98dc1ffe1ae019e9124e7cb76.jpg" style="margin: 0; width: 100%;" alt="" />
<p style="font-size: 12px; margin: 0;">PikWizard</p>
</a>
</span>
</span>
Free (free of charge)
Free for personal and commercial use.
Author: Creative Art
Similar Free Stock Images

Premium


Premium


Premium


Premium


Premium


Premium


Premium

Premium


Premium


Premium

Premium


Premium


Premium


Premium


Premium


Premium


Premium

Premium


Premium


Premium


Premium


Premium

Premium

Premium

Premium


Explore More Free Stock Images