
- Home >
- Stock Photos >
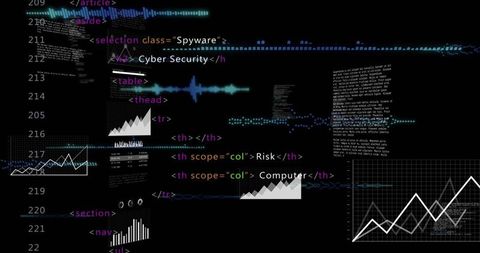
- Abstract Digital Data Analytics on Dark Background
Abstract Digital Data Analytics on Dark Background Image
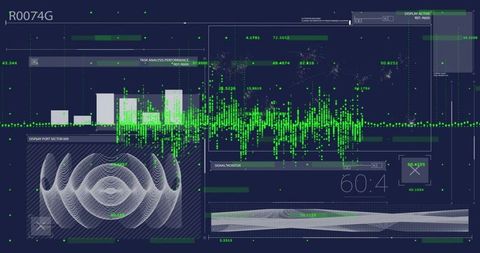
Depicts complex data analytics interfaces over a dark backdrop using vibrant visual elements such as grids and fluctuating graphs suggesting data processing and computation. Ideal for visuals related to global finance, advanced computing technologies, network systems, cybersecurity enhancements, artificial intelligence exploration, corporate presentations or educational uses aiming to explain big data theory or tools.
Powered by 


downloads
Tags:
More
Credit Photo
If you would like to credit the Photo, here are some ways you can do so
Text Link
photo Link
<span class="text-link">
<span>
<a target="_blank" href=https://pikwizard.com/photo/abstract-digital-data-analytics-on-dark-background/13901297e63986f775bd7b899cffc818/>PikWizard</a>
</span>
</span>
<span class="image-link">
<span
style="margin: 0 0 20px 0; display: inline-block; vertical-align: middle; width: 100%;"
>
<a
target="_blank"
href="https://pikwizard.com/photo/abstract-digital-data-analytics-on-dark-background/13901297e63986f775bd7b899cffc818/"
style="text-decoration: none; font-size: 10px; margin: 0;"
>
<img src="https://pikwizard.com/pw/medium/13901297e63986f775bd7b899cffc818.jpg" style="margin: 0; width: 100%;" alt="" />
<p style="font-size: 12px; margin: 0;">PikWizard</p>
</a>
</span>
</span>
Free (free of charge)
Free for personal and commercial use.
Author: Awesome Content
Similar Free Stock Images

Premium


Premium


Premium


Premium


Premium


Premium


Premium

Premium


Premium


Premium

Premium

Premium


Premium


Premium


Premium


Premium


Premium


Premium


Premium


Premium


Premium


Premium


Premium


Premium

Premium


Explore More Free Stock Images