
- Home >
- Stock Photos >
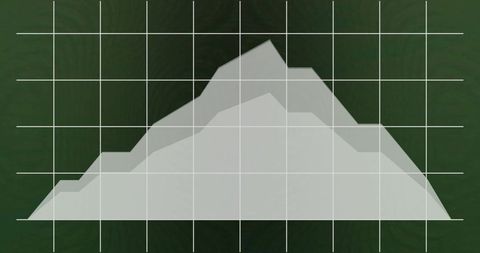
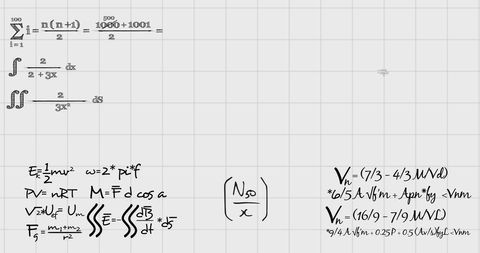
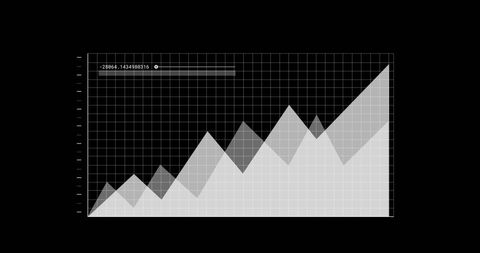
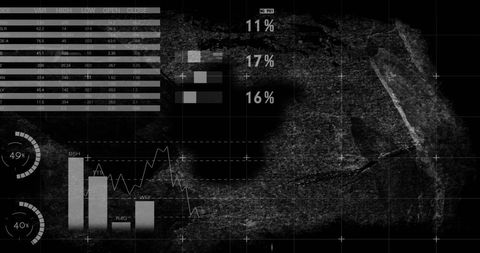
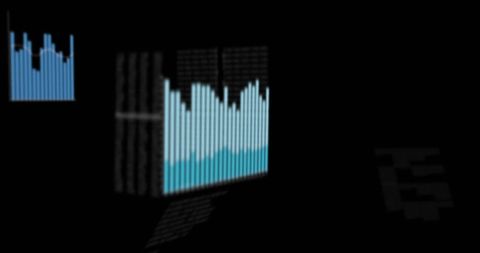
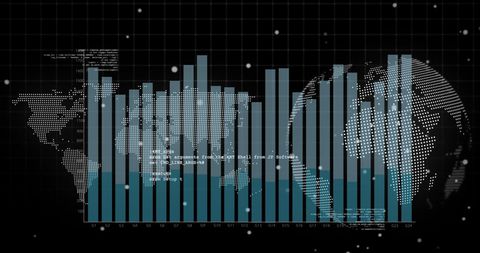
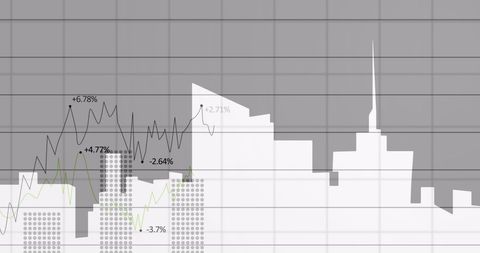
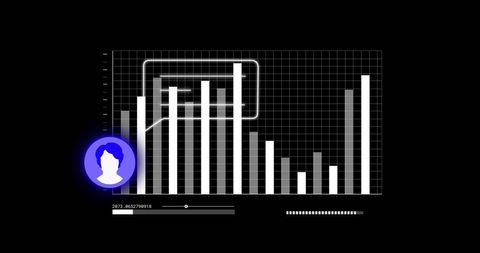
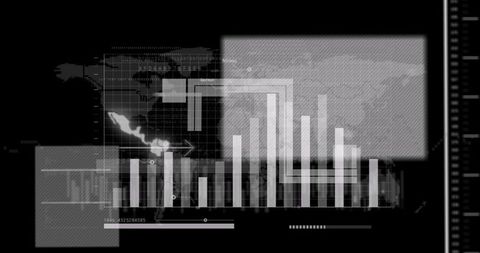
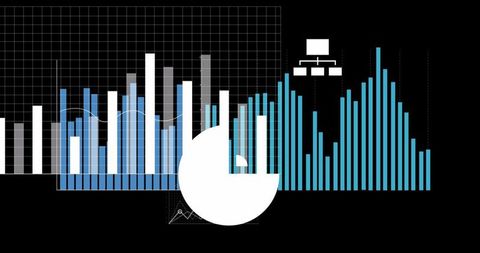
- Abstract Digital Data Graph on Black Background
Abstract Digital Data Graph on Black Background Image

This abstract visual depicts digital data processing and charting against a dark background, emphasizing themes of technology and finance. It is useful for websites, articles, or presentations focused on technological advancements, financial analysis, or digital transformation in businesses.
Powered by 


downloads
Tags:
More
Credit Photo
If you would like to credit the Photo, here are some ways you can do so
Text Link
photo Link
<span class="text-link">
<span>
<a target="_blank" href=https://pikwizard.com/photo/abstract-digital-data-graph-on-black-background/8274953b06c9a2f0371cfae9c370d2fa/>PikWizard</a>
</span>
</span>
<span class="image-link">
<span
style="margin: 0 0 20px 0; display: inline-block; vertical-align: middle; width: 100%;"
>
<a
target="_blank"
href="https://pikwizard.com/photo/abstract-digital-data-graph-on-black-background/8274953b06c9a2f0371cfae9c370d2fa/"
style="text-decoration: none; font-size: 10px; margin: 0;"
>
<img src="https://pikwizard.com/pw/medium/8274953b06c9a2f0371cfae9c370d2fa.jpg" style="margin: 0; width: 100%;" alt="" />
<p style="font-size: 12px; margin: 0;">PikWizard</p>
</a>
</span>
</span>
Free (free of charge)
Free for personal and commercial use.
Author: People Creations
Similar Free Stock Images

Premium


Premium

Premium


Premium


Premium


Premium

Premium

Premium


Premium


Premium

Premium

Premium


Premium


Premium

Premium

Premium


Premium


Premium


Premium


Premium


Premium


Premium


Premium


Premium


Premium


Explore More Free Stock Images