1. Home > 
  2. Stock Photos > 
  3. Abstract Digital Data Processing in Blue Interface

Abstract Digital Data Processing in Blue Interface Image

Abstract Digital Data Processing in Blue Interface

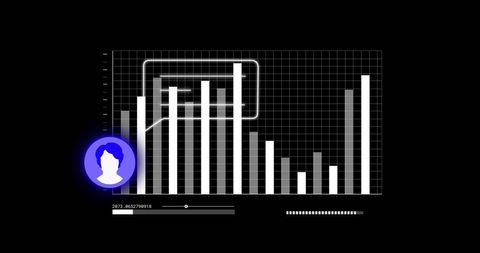
Digital representation featuring data processing analytics displayed on a blue background. Illustrated with bars and grid lines, this represents concepts of modern technology and trend analysis. Adding a decisive and visually engaging modern context, suitable for illustrating ideas in tech articles, data-driven websites, financial services pages or presentations revolving around digital innovations.

Powered by Adobe logo
Image of data processing and shapes on blue background - Powered by AdobeBlue technology background with gears and arrows depicting innovation and mechanical progress - Powered by Adobeabstract blue background with bokeh and rays - Powered by AdobeInternet cyberspace internet data collection analytical computer ai artificial intelligence calculation, blue background banner copyspace. - Powered by AdobeNeon frame surrounding data processing on a blue background, emphasizing digital interface design - Powered by Adobe

Credit Photo

If you would like to credit the Photo, here are some ways you can do so

Free (free of charge)

Free for personal and commercial use.

Author: Authentic Images

Similar Free Stock Images

Financial Data Visualization and Digital Analysis with World Map
Premium
AI network visualization on a blue background focusing on data processing and digital connections, technological awareness day
Increasing Financial Graph with Urban Cityscape Background
Financial Bar Graph Overlapping Modern City Skyline
Cityscape Background with Overlaid Financial Graph Indicating Growth
Digital Financial Graph Overlay on Cityscape
Premium
Hand interacting with glowing research roadmap interface on a blue background
Data Processing Concept with Financial Charts and Brain Imagery
Digital Data Analysis Over Blue Background
Financial Data Trend Analysis with Graphs on Green Background
Digital Graph of Financial Data Overlays Cloudy Horizon
Premium
Finger interacting with glowing digital interface icons on blue background.
Digital Financial Data Chart with Global Network Interface
Digital Chart Displayed Over Modern Office Tables
Digital Data Interface on Office Desk Monitor in Blue Tones
Digital Bar Graph on Dark Global Business Interface
Premium
Hand Interacting with a Global Network of Digital Icons on a Blue Background
Digital Financial Data and Statistics Visualization Concept
Colorful Bar Chart Displayed Over Blue Background
Financial Data on Office Desk with Digital Charts
Data Processing Visualization with Digital Charts on Blue Background
Premium
Professional businessman interacting with virtual network on tablet representing digital transformation and business process automation with interconnected icons on a blue background
Digital Financial Data Processing with Blue Background
Futuristic Financial Data Interface in Modern Office Environment
Digital Data Chart on Blue Background with Grid Lines
Futuristic Digital Data Analysis Background with Bar Graphs
Premium
The word "Loading" embossed on a blue background with water droplets, suggesting data processing or anticipation.
Data Processing with Digital Bar Chart Interface
Digital Financial Data Processing Over Grid with Global Map
Financial Data Visualization on Blue Graphical Background
Overlay of Digital Analytics Panels in Modern Office
Digital Data Analytics Overlaying Cityscape
Data Processing and Analytics Over Cityscape at Night
Premium
A finger touches a digital screen with business icons on a blue background
Financial Graph Overlay with Cityscape Background
Financial Graph Over Cityscape Illustrating Global Business Trends
Financial Bar Graph Over Urban Cityscape
Digital Bar Chart Display on Dark Grid Background
Premium
abstract tech background with neon-lit circuit boards, wires, and microchips, set against a dark, gradient blue background.
Urban Digital Data Analysis with Graph Overlay
Digital Financial Graph Waves Overlay High-Tech Theme
Abstract Financial Market Analysis with Candlestick and Bar Charts
Global Business Analytics and Growth Concept Hologram
Premium
A close up illustration showcases a hand interacting with a digital interface, featuring glowing circular elements and data visualizations set against a textured blue background, highlighting...
Digital Graphs and Trading Data Visualization in Dark Composition
Digital Data Processing on Office Desk with Graph Interface
Graphs and Charts Over Coffee Machines Indicating Business Analysis
Business Data Bar Chart Overlay on Desk in Office
Premium
A modern computer screen displaying colorful graphs and data analytics against a soft blue background.
Digital Financial Data Overlaid on Office Background
Digital Financial Data Visualization Across Office Desk
Abstract Financial Data and Charts in Urban City Background
Digital Business Graphs with Growth and Analysis Concepts
Premium
Woman using smartphone with AI technology concept and digital futuristic interface graphics on blue background representing innovation and data analysis. Ai generative
Financial Data Processing Bar Graph on Minimalist Background
Bar Graph with Grid on Abstract Blue Background
Data Analytics Graph with Modern Digital Interface
Digital Interface with Data Processing and Graphs
Premium
Finger touching glowing ISO icon, digital interface with security and data protection symbols, modern technology concept, blue background, innovation and compliance, futuristic business
Abstract Financial Chart with Statistics on Yellow Background
Hacked Text Over Digital Data Graph on Black Background
Neon sustainability finance dashboard showing CO2 EV euro metrics with candlestick charts
Digital Data Processing Visualization Over Cityscape
Futuristic Data Visualization Bar Graph Concept
Financial Graph Overlay on Cityscape Illustrating Market Trends
Premium
Robotic hand holding a glowing AI symbol against a blue background with digital particles, representing artificial intelligence.
Digital Financial Graph Overlaying Cityscape
Financial Bar Chart Displayed Over Blurred City Skyline Background
Abstract Financial Graph and Data Analysis Background
Digital Bar Graph Superimposed over Atmospheric Clouds
Premium
Businesswoman holding tablet with digital folder and checkmark icon representing document verification concept on blue background.
Digital Interface with Global Data Processing Concept
Abstract Chart with Multicolor Accents Representing Business Analytics
Digital Holographic Business Growth Charts
Financial Data Visualization Over Cityscape in Foggy Setting
Premium
Minimalist illustration of interconnected clouds on a blue background, symbolizing cloud computing and data storage.
Business Data Analytics Over Office Desk
Financial Data Analysis on Transparent Grid Background
Financial Data Visualization Over Office Workspace
Abstract Statistics and Graphs on Purple Background
Premium
Image of data processing and media icons over blue background
Virtual Bar Graph Over Modern Office Background
Digital Bar and Line Chart with Financial Growth Analysis
Office Background with Bar Chart Overlaying Data Analysis Concept
Visualizing Financial Data Overlaying AI Conceptual Brain
Premium
Finger pointing at updating bar with icons on blue background indicating system software upgrade process
Digital Bar Graph with Blue Background Indicating Data Analysis
Digital Bar Graph Interface Over Empty Office Background
Digital Data Graphs Overlaying Urban Background
Futuristic Financial Data and Analytics Visualization
Premium
AI chip background on technology blue background. Circuit board. Ai Tech bg. Semiconductor or CPU processor. Artificial intelligence concept. Abstract digital vector illustration. Big data.
Digital Graph Interface Illustrating Financial Data Analysis
Displaying futuristic analytics dashboard with dual charts, neon blue HUD metrics
Futuristic Data Visualization with Bar Graphs and Digital Interface
Abstract Data Visualization with Bars and Circular Elements
Financial Bar Graph Over Modern Cityscape with Abstract Digital Interface
Financial Bar Graph Overlaying Urban Cityscape Background
Premium
Internet cyberspace internet data collection analytical computer ai artificial intelligence calculation, blue background banner copyspace.
Data Processing Graph with Digital Interface Elements
Digital Graphs and Data Analysis Hologram
Researching Data with Analytical Charts and Laptop
Digital Data Visualization with Global Interface
Premium
Abstract blue background with glowing circuit lines, digital connections, representing futuristic technology, data transmission, electronic systems, cyber network, innovation in high-tech environments
Digital Bar Graph with Blue Data Visualization
IT Technician Analyzing Data with Holographic Graphs in Server Room
Abstract Data Analysis Concept with Gradient Background
Dynamic Data Visualization with Graphs over Blue Background
Premium
A digital illustration of interconnected icons representing data flow and user interface on a glowing blue background. Central text states API
Digital Growth Metrics with Dynamic Data Visualization
Financial Data Visualization in Modern Office
Colorful Bar Chart Data Visualization on Gradient Blue Background
Business Data Analysis Overlaid on Blurred Office Background
Premium
Completed documents displayed on a glass screen against a soft blue background
Digital Financial Data Charts on Blue Background
Dynamic Financial Data Visualization in Digital Blue
Digital Bar Chart Interface on Transparent Office Background
Digital Charts Displaying Data Analytics in Technology Background
Premium
Digital checkmark and task list icons floating above a tablet held by a person in a suit on a dark abstract neon blue background.
Digital Profile Security in Data Visualization Interface
Abstract Financial Data Analysis on Blue Digital Background
Financial Data Analysis Graph on Blue Background Concept
Digital Data Processing Graph Overlay on Office Desk
Premium
Robotic hand interacting with ai interface and application icons on a blue background showcasing artificial intelligence technology
Futuristic Blue Analytics Dashboard Displaying Holographic Area and Bar Charts with Global Data Grid