
- Home >
- Free Stock Photos & Images >
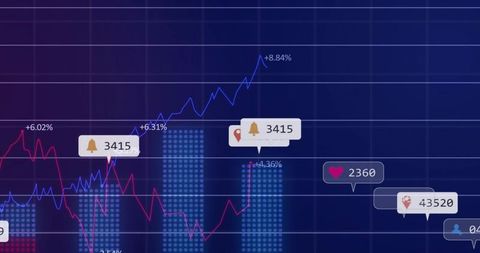
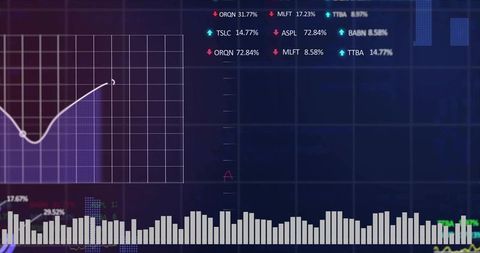
- Abstract Digital Data Visualization with Analytics Interface
Abstract Digital Data Visualization with Analytics Interface Free Stock Image

Vibrant representation of analytics with overlapping charts and percentage data creates effective visual for digital finance concepts. Ideal for presentations or content on data-driven strategies and technological advancements in financial sectors.
Powered by  - Get 15% off with code: PIKWIZARD15


downloads
Tags:
More
Credit Photo
If you would like to credit the Photo, here are some ways you can do so
Text Link
photo Link
<span class="text-link">
<span>
<a target="_blank" href=https://pikwizard.com/photo/abstract-digital-data-visualization-with-analytics-interface/d098171a92c35e656e0cb7c30a41740c/>PikWizard</a>
</span>
</span>
<span class="image-link">
<span
style="margin: 0 0 20px 0; display: inline-block; vertical-align: middle; width: 100%;"
>
<a
target="_blank"
href="https://pikwizard.com/photo/abstract-digital-data-visualization-with-analytics-interface/d098171a92c35e656e0cb7c30a41740c/"
style="text-decoration: none; font-size: 10px; margin: 0;"
>
<img src="https://thumbs.wbm.im/pw/medium/d098171a92c35e656e0cb7c30a41740c.jpg" style="margin: 0; width: 100%;" alt="Abstract Digital Data Visualization with Analytics Interface" />
<p style="font-size: 12px; margin: 0;">PikWizard</p>
</a>
</span>
</span>
Free (free of charge)
Free for personal and commercial use.
Author: Authentic Images
Similar Free Stock Images


Premium


Premium


Premium


Premium


Premium


Premium


Premium


Premium


Premium


Premium


Premium


Premium


Premium


Premium


Premium


Premium


Premium


Premium


Premium


Premium


Premium


Premium


Premium


Premium


Premium

Explore More Free Stock Images