
- Home >
- Stock Photos >
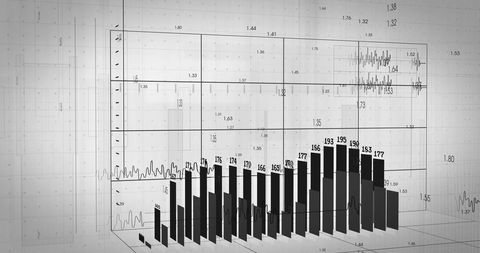
- Abstract Digital Data Visualization with Graphs and Charts
Abstract Digital Data Visualization with Graphs and Charts Image
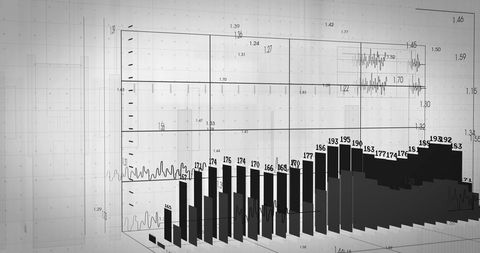
Abstract representation of digital data combining charts and graphs on a white background. Accurate for illustrating the intersection of technology and data analysis in business and finance contexts. Beneficial for marketing materials, presentations, or workshops focusing on data collaboration, analytics, and tech-driven insights.
Powered by 


downloads
Tags:
More
Credit Photo
If you would like to credit the Photo, here are some ways you can do so
Text Link
photo Link
<span class="text-link">
<span>
<a target="_blank" href=https://pikwizard.com/photo/abstract-digital-data-visualization-with-graphs-and-charts/5ce6a023da3e81077b5e5b67dd5c312a/>PikWizard</a>
</span>
</span>
<span class="image-link">
<span
style="margin: 0 0 20px 0; display: inline-block; vertical-align: middle; width: 100%;"
>
<a
target="_blank"
href="https://pikwizard.com/photo/abstract-digital-data-visualization-with-graphs-and-charts/5ce6a023da3e81077b5e5b67dd5c312a/"
style="text-decoration: none; font-size: 10px; margin: 0;"
>
<img src="https://pikwizard.com/pw/medium/5ce6a023da3e81077b5e5b67dd5c312a.jpg" style="margin: 0; width: 100%;" alt="" />
<p style="font-size: 12px; margin: 0;">PikWizard</p>
</a>
</span>
</span>
Free (free of charge)
Free for personal and commercial use.
Author: Awesome Content
Similar Free Stock Images

Premium


Premium


Premium


Premium


Premium


Premium


Premium


Premium


Premium

Premium


Premium


Premium


Premium

Premium


Premium


Premium


Premium


Premium


Premium


Premium


Premium


Premium

Premium


Premium


Premium


Explore More Free Stock Images