- Home >
- Stock Photos >
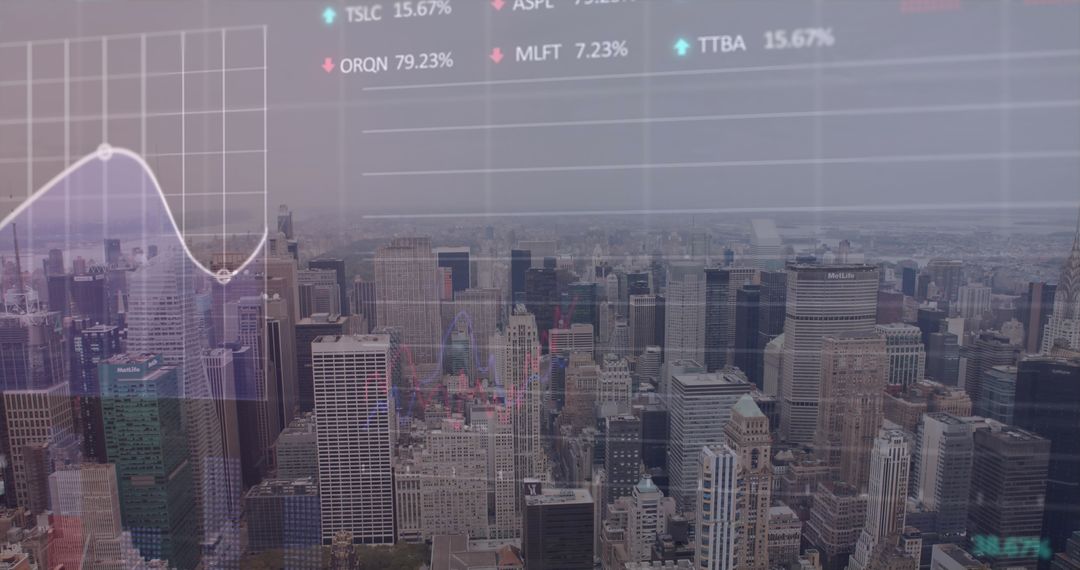
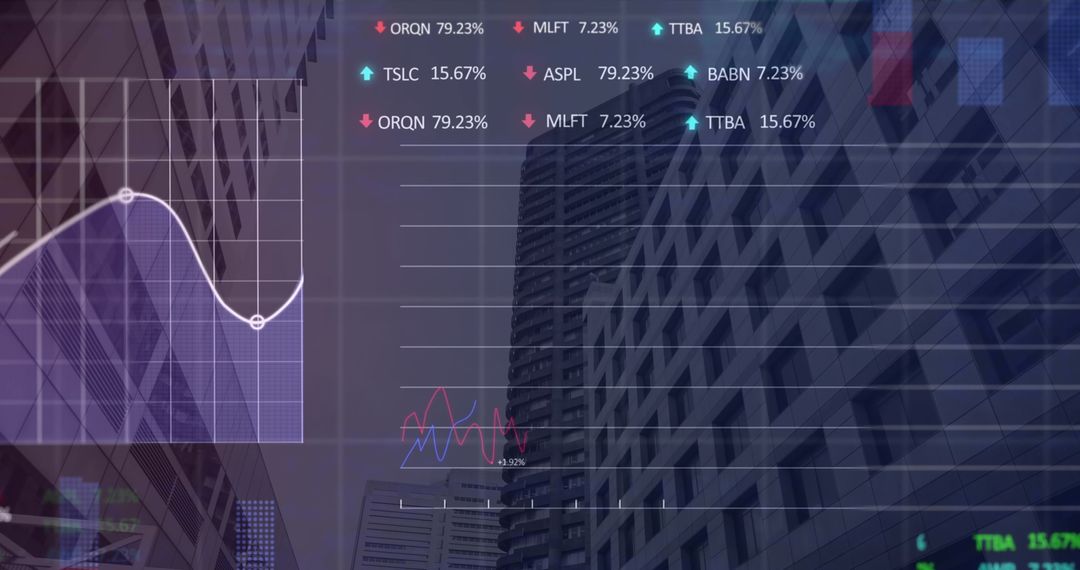
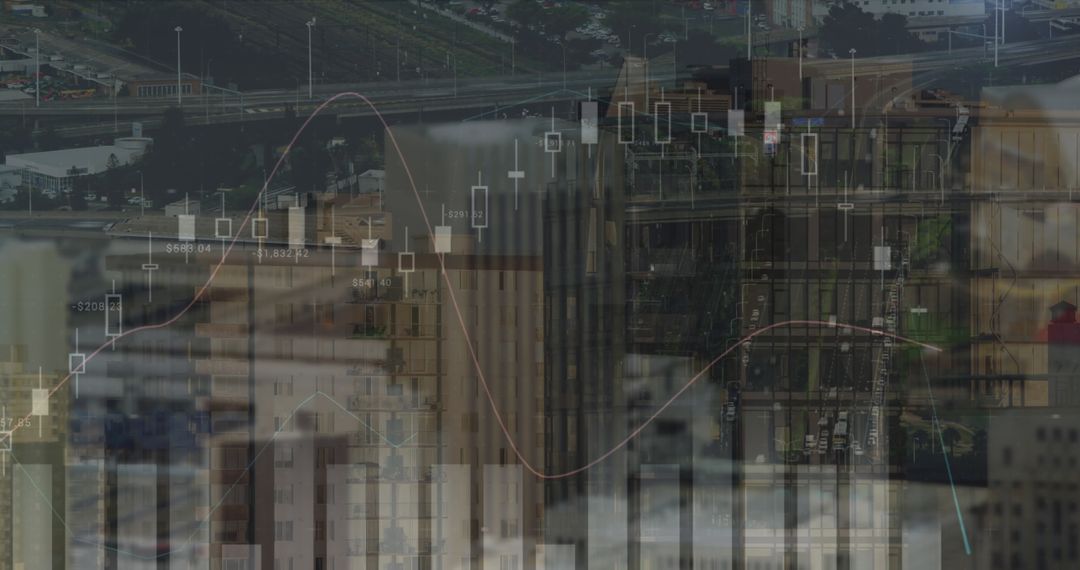
- Abstract Digital Data with Inverted Urban Landscape
Abstract Digital Data with Inverted Urban Landscape Image

Digital render combines cityscape inversion and data charts, illustrating modern business intelligence. Suitable for tech innovation brochures, financial service covers, and economic analysis presentations.
Powered by  - Get 15% off with code: PIKWIZARD15


0
downloads
downloads
Tags:
More
Credit Photo
If you would like to credit the Photo, here are some ways you can do so
Text Link
photo Link
<span class="text-link">
<span>
<a target="_blank" href=https://pikwizard.com/photo/abstract-digital-data-with-inverted-urban-landscape/0f5d95352f7d3057a4c8249f4815b0c9/>PikWizard</a>
</span>
</span>
<span class="image-link">
<span
style="margin: 0 0 20px 0; display: inline-block; vertical-align: middle; width: 100%;"
>
<a
target="_blank"
href="https://pikwizard.com/photo/abstract-digital-data-with-inverted-urban-landscape/0f5d95352f7d3057a4c8249f4815b0c9/"
style="text-decoration: none; font-size: 10px; margin: 0;"
>
<img src="https://pikwizard.com/pw/medium/0f5d95352f7d3057a4c8249f4815b0c9.jpg" style="margin: 0; width: 100%;" alt="" />
<p style="font-size: 12px; margin: 0;">PikWizard</p>
</a>
</span>
</span>
Free (free of charge)
Free for personal and commercial use.
Author: People Creations
Similar Free Stock Images

Premium


Premium


Premium


Premium


Premium


Premium


Premium


Premium


Premium


Premium


Premium


Premium


Premium


Premium


Premium


Premium


Premium


Premium


Premium


Premium


Premium


Premium


Premium


Premium