- Home >
- Stock Photos >
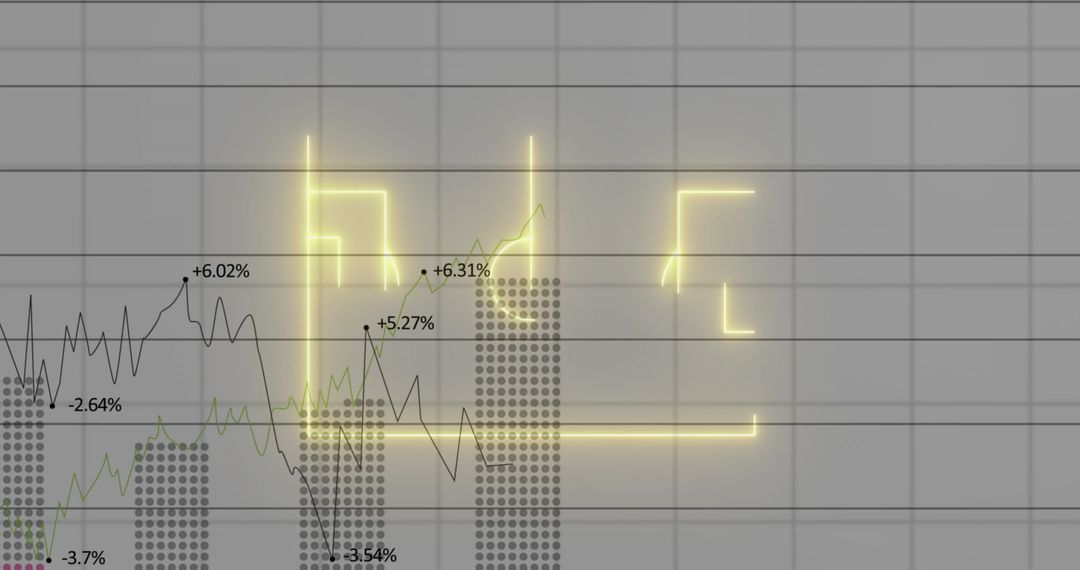
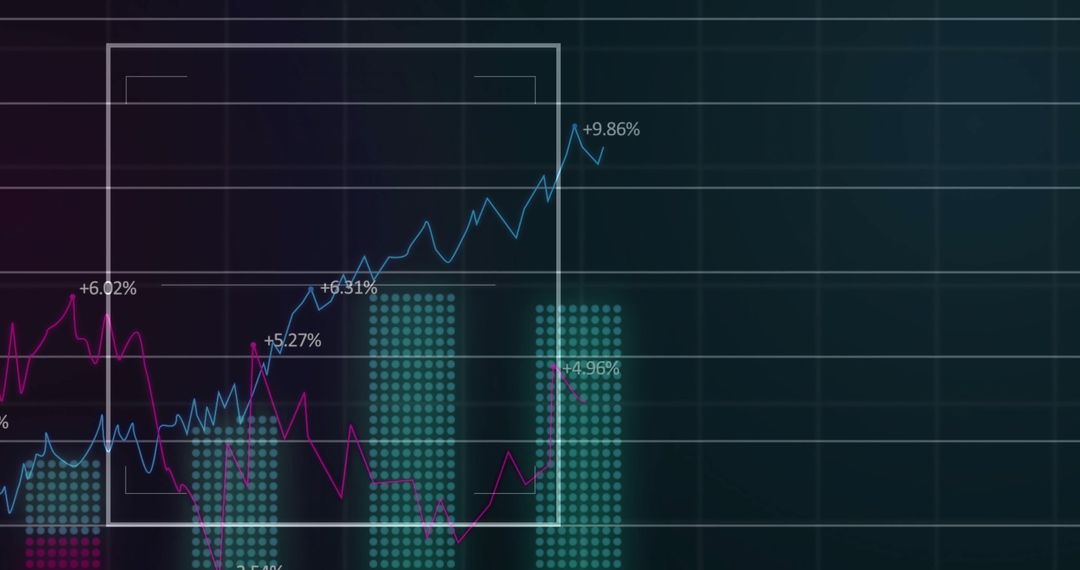
- Abstract Digital Finance Chart Showing Fluctuating Graph Lines
Abstract Digital Finance Chart Showing Fluctuating Graph Lines Image

Abstract digital finance chart exhibits multiple fluctuating graph lines, presenting financial data and analytics in a dynamic way. Ideal for illustrating stock market trends, business performance, and data analytics in presentations and reports. Useful for websites and applications related to finance, investment, and technological advancements in data management.
Powered by 


2
downloads
downloads
Tags:
More
Credit Photo
If you would like to credit the Photo, here are some ways you can do so
Text Link
photo Link
<span class="text-link">
<span>
<a target="_blank" href=https://pikwizard.com/photo/abstract-digital-finance-chart-showing-fluctuating-graph-lines/d1cf387d1991f436ea61416a3574e7c2/>PikWizard</a>
</span>
</span>
<span class="image-link">
<span
style="margin: 0 0 20px 0; display: inline-block; vertical-align: middle; width: 100%;"
>
<a
target="_blank"
href="https://pikwizard.com/photo/abstract-digital-finance-chart-showing-fluctuating-graph-lines/d1cf387d1991f436ea61416a3574e7c2/"
style="text-decoration: none; font-size: 10px; margin: 0;"
>
<img src="https://pikwizard.com/pw/medium/d1cf387d1991f436ea61416a3574e7c2.jpg" style="margin: 0; width: 100%;" alt="" />
<p style="font-size: 12px; margin: 0;">PikWizard</p>
</a>
</span>
</span>
Free (free of charge)
Free for personal and commercial use.
Author: Creative Art
Similar Free Stock Images

Premium


Premium


Premium


Premium


Premium


Premium


Premium


Premium


Premium


Premium


Premium


Premium


Premium


Premium


Premium


Premium


Premium


Premium


Premium


Premium


Premium


Premium


Premium


Premium