1. Home > 
  2. Stock Photos > 
  3. Abstract Digital Financial Chart Graph with Trends

Abstract Digital Financial Chart Graph with Trends Image

Abstract Digital Financial Chart Graph with Trends

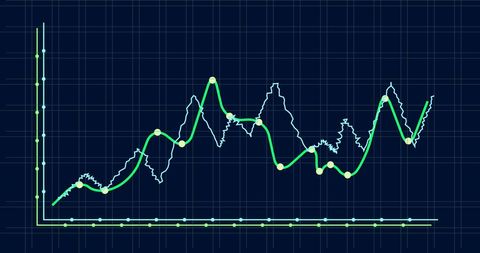
Abstract visualization shows complex financial charts with dynamic paths, reflecting economy or stock market trends. Used for presentations, analytics seminars, finance blogs, technology articles, economic forecasts dealings.

Powered by Shutterstock logo - Get 15% off with code: PIKWIZARD15
Financial graph with uptrend line technology bar chart of stock market on blue color background - Powered by Shutterstock - Get 15% off with code: PIKWIZARD15Stock market chart with blue candlestick graph and trading data on a dark background, Stock market finance chart with business trading analytics, exchange data, and financial growth graph.	 - Powered by Shutterstock - Get 15% off with code: PIKWIZARD15Stock market business and exchange financial growth graph. Business chart data graph diagram, business trading graph investment growth, global trend arrow up and down. - Powered by Shutterstock - Get 15% off with code: PIKWIZARD15Businessman analyzing financial data using a digital tablet and holographic charts. - Powered by Shutterstock - Get 15% off with code: PIKWIZARD15Business data dashboard provide business intelligence analytic for marketing strategy planning snugly with big data set to analyze customer demands and foreseeing business future. - Powered by Shutterstock - Get 15% off with code: PIKWIZARD15

Credit Photo

If you would like to credit the Photo, here are some ways you can do so

Free (free of charge)

Free for personal and commercial use.

Author: Creative Art

Similar Free Stock Images

Green Data Graph on Black Digital Interface
Premium
Displaying financial data fluctuating on dashboard with turquoise line, data labels and golden arc. Data visualization, analytics, modern design, technological, data analytics, dashboard
Fluctuating Financial Graph on Green Grid Background
Digital Financial Data with Graph and Grid Patterns
Dynamic Line Chart with Histogram on Digital Grid Background
Upward Stock Market Arrow with Binary Code Background
Rising Financial Data Graph on Digital Grid Background
Dynamic Financial Data Chart Showing Trend Analysis
Innovative Data Analysis with Dynamic Line Graph and Digital Elements
Dynamic Data Visualization and Financial Growth Curves
Digital Data Analysis with Green Line Graph on Grid Background
Financial Data Analysis with Interactive Graphs
Analyzing Accelerating Data Trends on Grid with Tech Insights
Premium
Data analytics dashboard with charts, indicators, and performance metrics, reveals trends, data analytics drives growth, supports insight, and data analytics improves decisions. Vouch
Fluctuating Digital Stock Market Data Chart
Rising Financial Graph on Dark Grid Background
Financial Data Line Graph on Digital Display
Abstract Financial Graph with Rising Waves on Red Gradient
Global Networking Concept with 6G Technology Display
Digital Finance Chart Overlaying Globe Background
Rising Digital Graph and Data Visualizations on Black Background
European Market Data Overlay with EU Flag and Financial Graphs
Premium
Showing price labels and up or down triangle indicators on trading screen, with candlestick chart. Financial analysis, investment, market trends, digital dashboard, technical analysis, stock charts,
Digital Financial Data Overlaying City Skyline at Dusk
Financial Data Flow against Urban Skyline Backdrop
Abstract Digital Finance Chart Showing Fluctuating Graph Lines
Digital Interface with Global Financial Graphs Background
Futuristic Digital Graph Showing Data Trends on Analytic Interface
Dynamic Stagflation Concept Displaying Economic Burdens
Digital Stock Market Graph Red Trendline on Green Background
Financial Growth Stock Nikkei in Urban City Skyline
Premium
Businessman analyzing virtual graph chart on laptop screen. Concept of data analysis, financial growth, performance tracking, digital technology, and business intelligence.
Dynamic Financial Graph with Wavy Data Line over Navy Background
Futuristic Digital Representation of DNA Strand
Dynamic Stock Market Chart with Fluctuating Trends and Data Points
Futuristic Financial Chart with Declining Trend
Financial Data Analysis Vibrant Graphs on Blue Background
Digital Financial Data Graph Showcasing Market Trends
Data Analytics Graphs on Digital Interface Background
Neon Green Electrocardiogram Wave on Black Background
Premium
Futuristic Digital Growth Chart – 3D Bar Graph with Glowing Blue Data Visualization
Premium
Black man using stylus interacting with digital tablet displaying financial charts and graphs, analyzing business data at desk with printed documents and glass of water visible in background
Digital Data Processing with Graph and Grid Technology Interface
Data Analytics and Financial Growth Indicators
Green Line Graph on Dark Digital Grid
Red Graph Showing Downward Trend on Digital Grid
Premium
Business data analytics and intelligence dashboard concept, businessman using futuristic holographic graphs and charts on laptop, big data analysis, KPIs, statistics, digital transformation.
Financial Data Processing with Rising Graphs
Green Line Graph with Data Points on Grid Background
NFT Financial Data Visualization with Digital Graph Overlay
Premium
A professional person analyzes financial growth and business data on a digital screen. Perfect for data science, market research, analytics dashboards, and corporate performance monitoring concepts.
Financial Stock Market Data Visualization with Declining Trends
Financial Graph Analysis on Green Grid Background
Global Economic Trends Highlighted on World Map with Graphs
Financial Data Analysis in Digital Interface with Graphs
Glowing Cardiology Graph on Dark Background
Colorful Data Visualization on Dark Background
Economic and Political Factors Influence Investment Trends
Premium
Businessman analyzing growth data using digital dashboard and laptop. Futuristic interface showing rising graph and financial metrics. Concept of smart investment, fintech, and business performance.
Premium
Digital bar graph with rising arrows and percentage symbol on laptop screen. Concept of financial growth, investment return, business analytics, and modern fintech data visualization.
Premium
Business team working together on a project, discussing strategy and analyzing financial data in a modern office
Slumpflation Concept with Graph and Digital Display
Digital Graphs and Data Visualization on Green Background
Fluctuating Stock Market Graph with Dramatic Peaks
Dynamic Business Data and Cityscape Visualization
Premium
Crisis US economy, recession risk. Falling red color candlestick chart. Financial and stock market chart concept  background photo.
Digital Data Visualization with Trend Lines and Percentage Changes
Digital Finance: Modern Stock Market Analysis Display
Abstract Financial Graph Illustration on Dark Background
Dynamic Financial Graphs Overlaying Modern Cityscape
Premium
stock market investment trading graph growth. Trade business analytics graph and financial chart.
Financial Graphs Displaying Business Trends on Grid Background
Financial Graph Displayed Over City Skyline at Sunset
Financial Data Processing Visualization with Green Digital Grid
Rising Graph Line on Digital Green Grid Background
Premium
Displaying finance dashboard on dark themed GUI, with vertical bar chart and curved line graph. Data analytics, finance, investment, data visualization, technology, dashboard, digital interface
Dynamic Financial Graphs Illustrating Market Trends
Financial Data Analysis with Futuristic Technology Interface
Digital Interface Visualizing DNA and Data Patterns
Dynamic Green Line Graph Depicting Financial Data
Premium
A business hand drawing a glowing rising graph with digital bars and arrows, symbolizing financial growth, data analytics, success, performance improvement, and modern business strategy in a digital
Dynamic Financial Data Visualizations on Grid Interface
Premium
Showing chart with candlestick bars, line graph, labels on screen, hex grid overlay, diagonal bars. Technology, finance, analytics, data, dashboard, visualization, digital
Dynamic Financial Graphs Overlaying Urban Skyline
Colorful Bar Graph on Dark Background Illustrates Data Trends
Futuristic Graph with Digital Globe Symbolizing Global Technology Connections
Falling Line Graph on Navy Background Illustrating Economic Decline
Analyzing Stock Market Trends with Dynamic Graphs and Data
Digital Interface Showing Global Business Data Analytics
Digital Graph Displaying Dynamic Data Analysis
Futuristic Graph and Data Visualization Interface Design
Analyzing Data Trends on Digital Graph Interface
Abstract DNA Helix Digital Network
Graph Lines Portraying Financial Data Trends
Dynamic Financial Data Waves in Digital Cyber World
Financial Data Charts with World Map on Blue Digital Background
Data Visualization on Security Shield Interface for Cyber Security
Premium
Visualizing central data analytics on digital interface, with pie charts bar graphs formulas. Futuristic, technology, visualization, infographics, digital, scientific, analytical
Premium
Development to success and motivation in 2026.Growth and development chart of company in new year 2026. Planning, opportunity, challenge and business strategy in new year 2026
Dynamic Financial Data on Digital Screen
Premium
candlestick chart for financial markets with moving averages and elements of technical analysis
Dynamic Financial Graph Over Red Background
Futuristic Global Finance Chart with Rotating Globe Animation
Cityscape with Digital Stock Market Graphs and Statistics
Dynamic Energy Particle Wave Concept on Metallic Gray Background
Premium
Close Up Computer Display with Red and Green Candlestick Charts with Financial Stock Market Information. Business, Digital Banking, Trading Software, Finance and Economy Concept
Stagflation Concept with Digital Financial Graphs
Financial Data Graph Rendering Global Market Trends
Fluctuating Financial Graph with Red Line on Green Grid
Dynamic Red Line Graph With Data Points on Gridded Background
Premium
Businessperson analyzing financial growth with monthly bar chart and upward trend line on laptop. Concept of business analytics, performance tracking, and data-driven strategy.
Dynamic Stock Market Graphs Over Digital Interface
Line Graphs on Digital Background Show Financial Data Trends
Dynamic Financial Stock Market Analysis Display
Data Trends and Analysis on 3D Digital Grid
Premium
Businessman analyzing financial data on digital tablet.
Abstract Sound Waves on Dark Background
Premium
laptop is open on a desk with a notebook and a stack of papers. The laptop screen displays a series of graphs and charts, suggesting that the user is working on a project or analyzing data
Premium
kpi, analytics, dashboard, data, chart, A person analyzing digital KPI dashboards and charts on a laptop, representing performance metrics, data analytics, and business strategy.
Abstract Financial Graph with Bar and Line Charts on Dark Background
Dynamic Financial Data Overlaid on Grid Background
Line Graph Illustrating Data Trend on Green Digital Background
Digital Data Network with Dynamic Connections
Premium
Analyst Reviewing Data Charts on Computer Screens
Dynamic Green Stock Market Chart with Upward Arrows
Explore More Free Stock Images