- Home >
- Stock Photos >
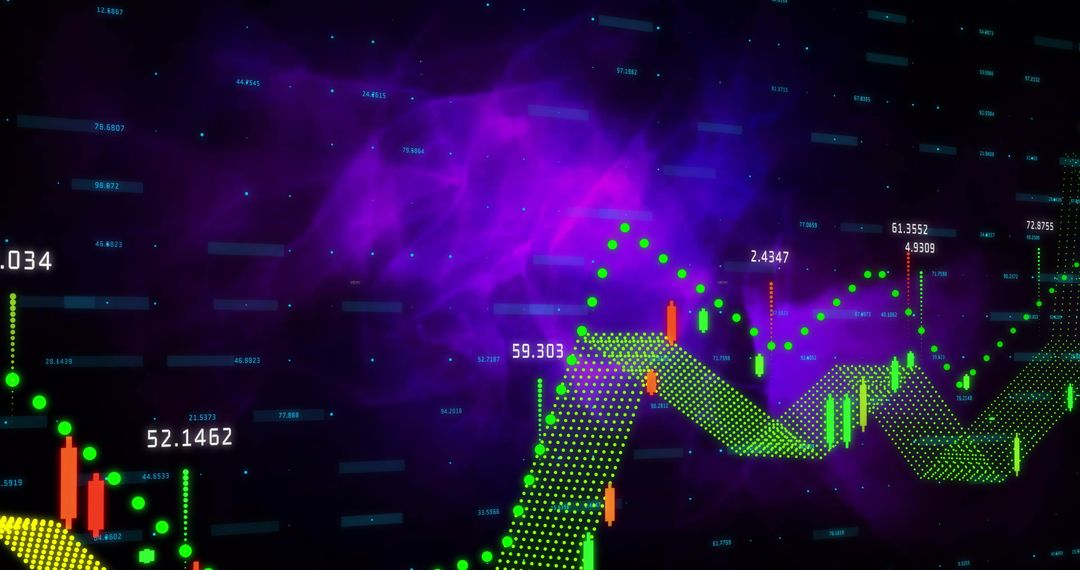
- Abstract Digital Financial Chart with Neon Candlesticks
Abstract Digital Financial Chart with Neon Candlesticks Image
Vibrant neon signals highlight dynamic financial algorithms on digital platforms. Perfect for illustrating articles on modern finance, trading apps, or stock market analysis. Useful for investment websites or fintech presentations to depict advanced technological analysis.
Powered by 


0
downloads
downloads
Tags:
More
Credit Photo
If you would like to credit the Photo, here are some ways you can do so
Text Link
photo Link
<span class="text-link">
<span>
<a target="_blank" href=https://pikwizard.com/photo/abstract-digital-financial-chart-with-neon-candlesticks/282384c8362097616b87a8f37532e324/>PikWizard</a>
</span>
</span>
<span class="image-link">
<span
style="margin: 0 0 20px 0; display: inline-block; vertical-align: middle; width: 100%;"
>
<a
target="_blank"
href="https://pikwizard.com/photo/abstract-digital-financial-chart-with-neon-candlesticks/282384c8362097616b87a8f37532e324/"
style="text-decoration: none; font-size: 10px; margin: 0;"
>
<img src="https://pikwizard.com/pw/medium/282384c8362097616b87a8f37532e324.jpg" style="margin: 0; width: 100%;" alt="" />
<p style="font-size: 12px; margin: 0;">PikWizard</p>
</a>
</span>
</span>
Free (free of charge)
Free for personal and commercial use.
Author: People Creations
Similar Free Stock Images
Premium


Premium


Premium


Premium


Premium


Premium


Premium


Premium


Premium


Premium


Premium


Premium


Premium


Premium


Premium


Premium


Premium


Premium


Premium


Premium


Premium


Premium


Premium

Premium