
- Home >
- Stock Photos >
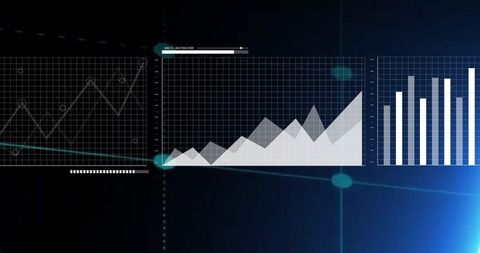
- Abstract Digital Financial Charts and Graphs Interface
Abstract Digital Financial Charts and Graphs Interface Image

Display of a complex network of financial charts and graphs offering a futuristic view of economic analysis and global markets. Perfect for representing concepts of financial insights, business valuation, and technology in modern finance presentations. Useful for businesses and educational materials focused on finance, digital markets, or global economy trends.
Powered by  - Get 15% off with code: PIKWIZARD15


downloads
Tags:
More
Credit Photo
If you would like to credit the Photo, here are some ways you can do so
Text Link
photo Link
<span class="text-link">
<span>
<a target="_blank" href=https://pikwizard.com/photo/abstract-digital-financial-charts-and-graphs-interface/0aa6ced39e8daa48e49adf0f4b071031/>PikWizard</a>
</span>
</span>
<span class="image-link">
<span
style="margin: 0 0 20px 0; display: inline-block; vertical-align: middle; width: 100%;"
>
<a
target="_blank"
href="https://pikwizard.com/photo/abstract-digital-financial-charts-and-graphs-interface/0aa6ced39e8daa48e49adf0f4b071031/"
style="text-decoration: none; font-size: 10px; margin: 0;"
>
<img src="https://pikwizard.com/pw/medium/0aa6ced39e8daa48e49adf0f4b071031.jpg" style="margin: 0; width: 100%;" alt="" />
<p style="font-size: 12px; margin: 0;">PikWizard</p>
</a>
</span>
</span>
Free (free of charge)
Free for personal and commercial use.
Author: Authentic Images
Similar Free Stock Images

Premium


Premium


Premium

Premium

Premium


Premium

Premium


Premium


Premium

Premium

Premium


Premium


Premium


Premium


Premium


Premium

Premium


Premium


Premium

Premium


Premium


Premium

Premium

Premium

Premium


Explore More Free Stock Images