- Home >
- Stock Photos >
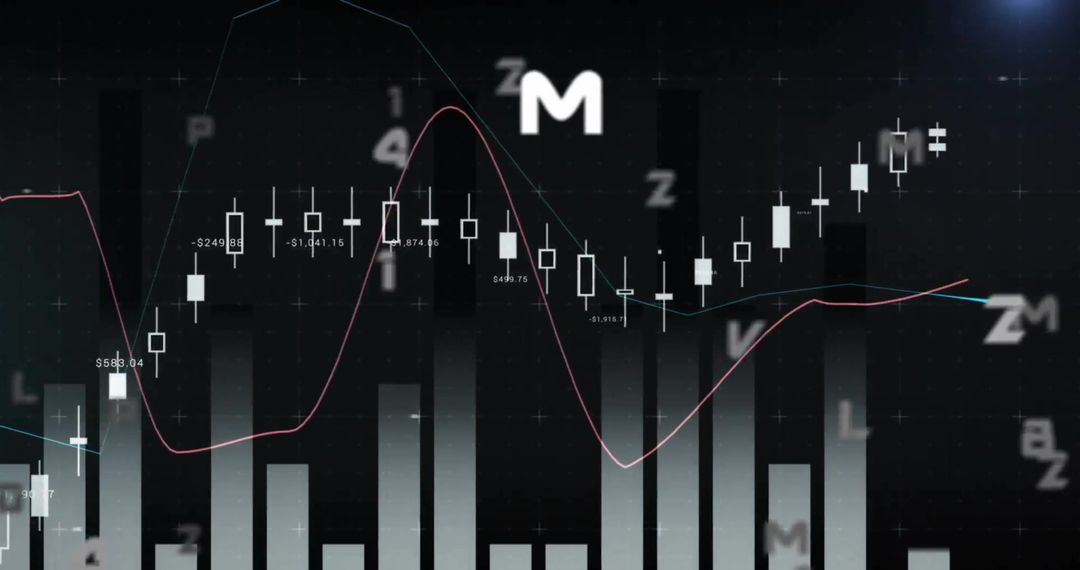
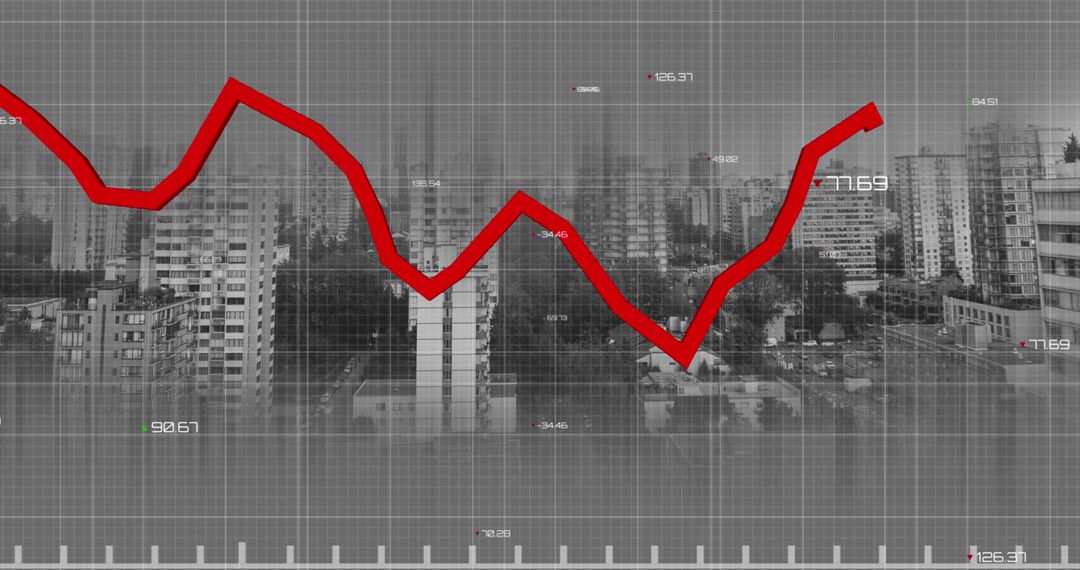
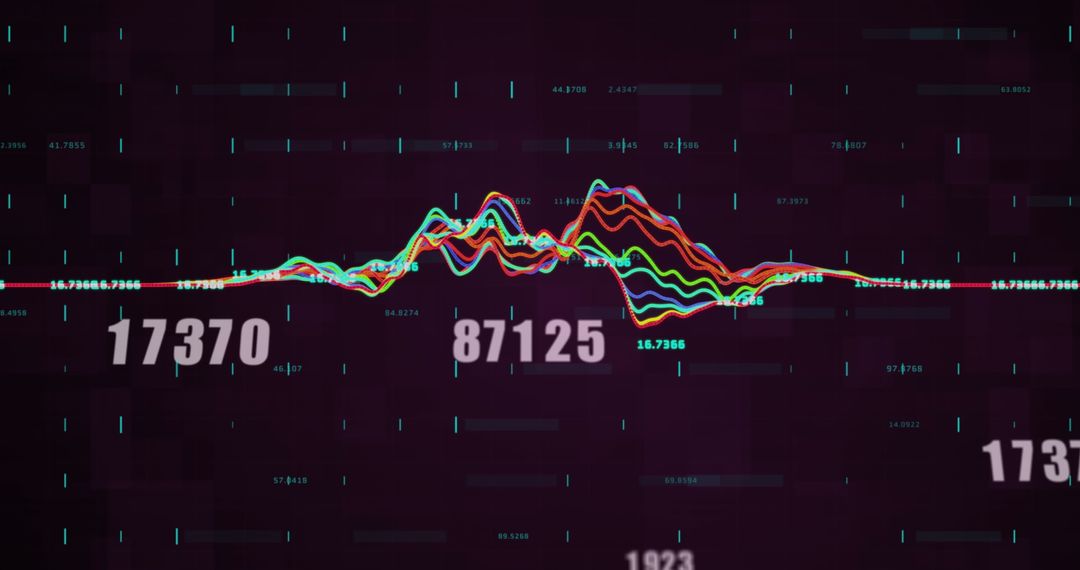
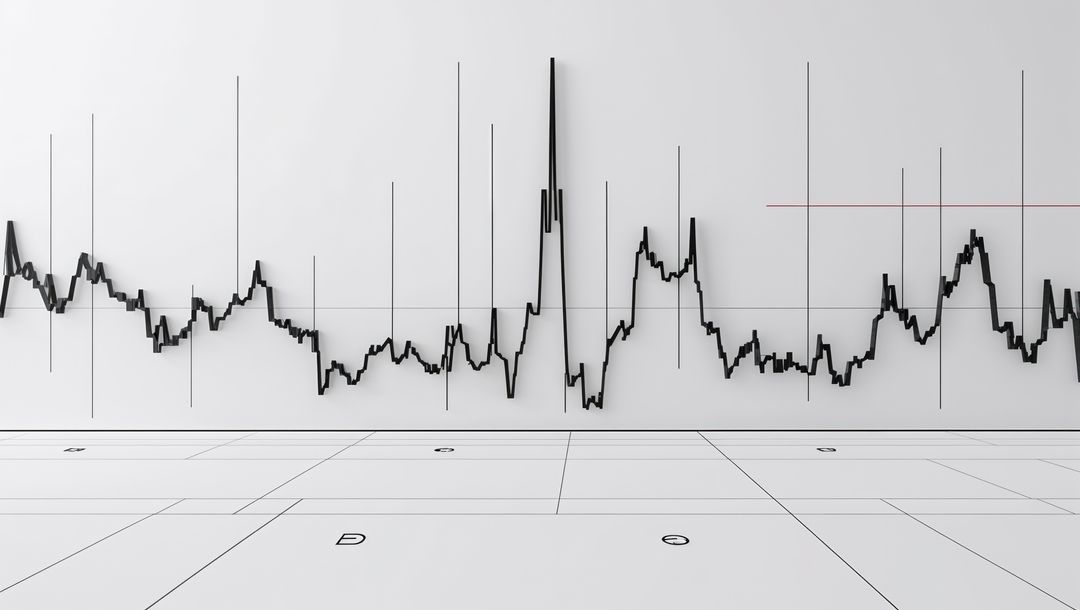
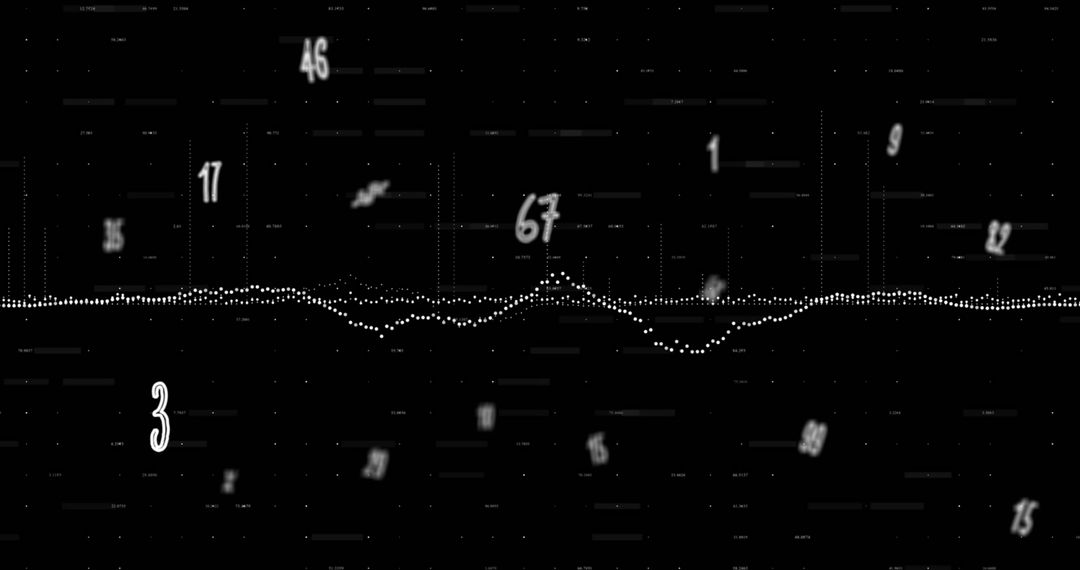
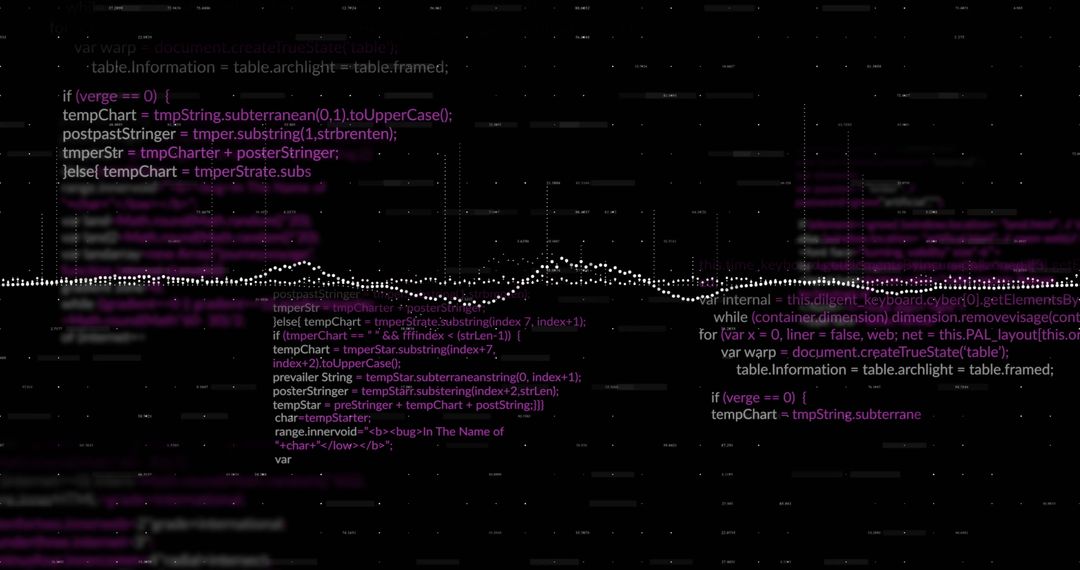
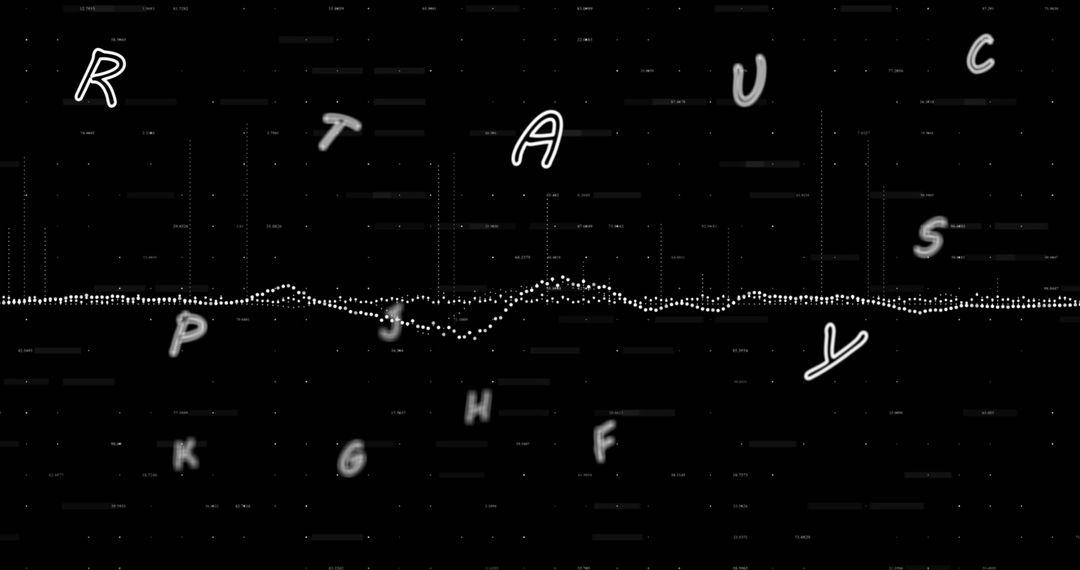
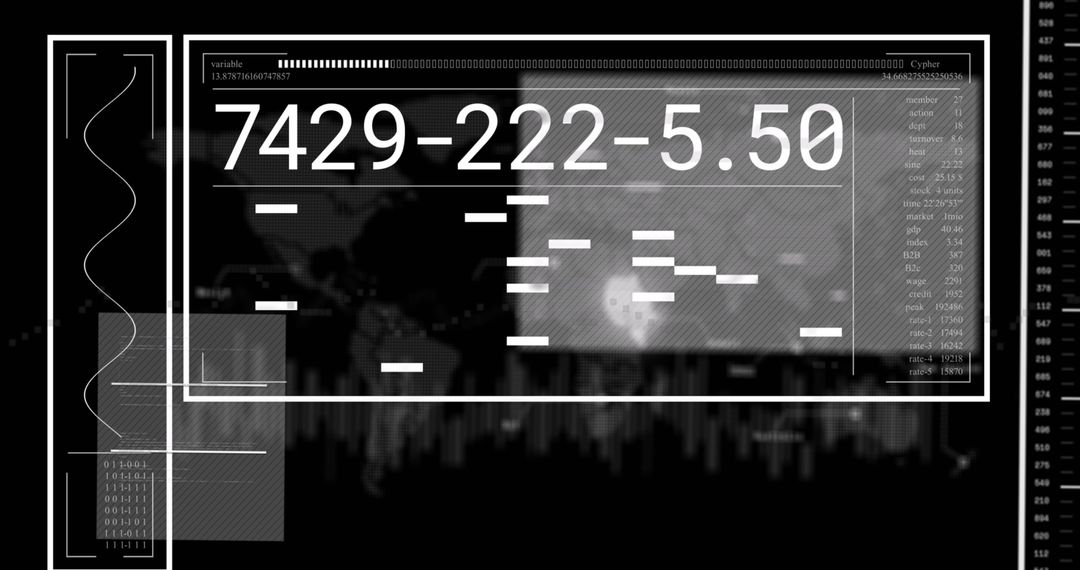
- Abstract Digital Financial Data Representation with Floating Letters
Abstract Digital Financial Data Representation with Floating Letters Image

This image of an abstract representation of financial data with digital lettering flowing through it is ideal for projects involving finance technology and analytics. Use it in presentations, websites, and articles that focus on financial trends, digital banking advancements or investing tools to illustrate innovation in the financial sector.
Powered by  - Get 15% off with code: PIKWIZARD15


0
downloads
downloads
Tags:
More
Credit Photo
If you would like to credit the Photo, here are some ways you can do so
Text Link
photo Link
<span class="text-link">
<span>
<a target="_blank" href=https://pikwizard.com/photo/abstract-digital-financial-data-representation-with-floating-letters/8bcc291da0a69891092cafb6bce8368f/>PikWizard</a>
</span>
</span>
<span class="image-link">
<span
style="margin: 0 0 20px 0; display: inline-block; vertical-align: middle; width: 100%;"
>
<a
target="_blank"
href="https://pikwizard.com/photo/abstract-digital-financial-data-representation-with-floating-letters/8bcc291da0a69891092cafb6bce8368f/"
style="text-decoration: none; font-size: 10px; margin: 0;"
>
<img src="https://pikwizard.com/pw/medium/8bcc291da0a69891092cafb6bce8368f.jpg" style="margin: 0; width: 100%;" alt="" />
<p style="font-size: 12px; margin: 0;">PikWizard</p>
</a>
</span>
</span>
Free (free of charge)
Free for personal and commercial use.
Author: People Creations
Similar Free Stock Images
Premium


Premium


Premium


Premium


Premium


Premium


Premium


Premium


Premium


Premium


Premium


Premium


Premium


Premium


Premium


Premium


Premium


Premium


Premium


Premium


Premium


Premium


Premium


Premium