
- Home >
- Stock Photos >
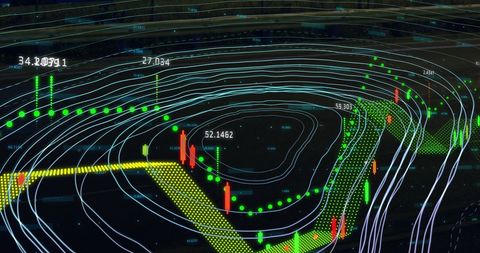
- Abstract Digital Financial Data Visualization with Graphs
Abstract Digital Financial Data Visualization with Graphs Image

Abstract visual of intertwining digital data points shows evolving financial trends related to global business networks and computing. Highlighting success via analytics, this image is suitable for presenting technology advancements in finance, illustrating topics in stock markets or analyzing data intricacies in financial sectors.
Powered by 


downloads
Tags:
More
Credit Photo
If you would like to credit the Photo, here are some ways you can do so
Text Link
photo Link
<span class="text-link">
<span>
<a target="_blank" href=https://pikwizard.com/photo/abstract-digital-financial-data-visualization-with-graphs/fcdefec93f59f303d815c90582e268a5/>PikWizard</a>
</span>
</span>
<span class="image-link">
<span
style="margin: 0 0 20px 0; display: inline-block; vertical-align: middle; width: 100%;"
>
<a
target="_blank"
href="https://pikwizard.com/photo/abstract-digital-financial-data-visualization-with-graphs/fcdefec93f59f303d815c90582e268a5/"
style="text-decoration: none; font-size: 10px; margin: 0;"
>
<img src="https://pikwizard.com/pw/medium/fcdefec93f59f303d815c90582e268a5.jpg" style="margin: 0; width: 100%;" alt="" />
<p style="font-size: 12px; margin: 0;">PikWizard</p>
</a>
</span>
</span>
Free (free of charge)
Free for personal and commercial use.
Author: Creative Art
Similar Free Stock Images

Premium

Premium

Premium


Premium


Premium
Premium


Premium
Premium

Premium


Premium

Premium


Premium

Premium


Premium


Premium


Premium


Premium


Premium


Premium


Premium


Premium


Premium

Premium


Premium

Premium


Explore More Free Stock Images