- Home >
- Stock Photos >
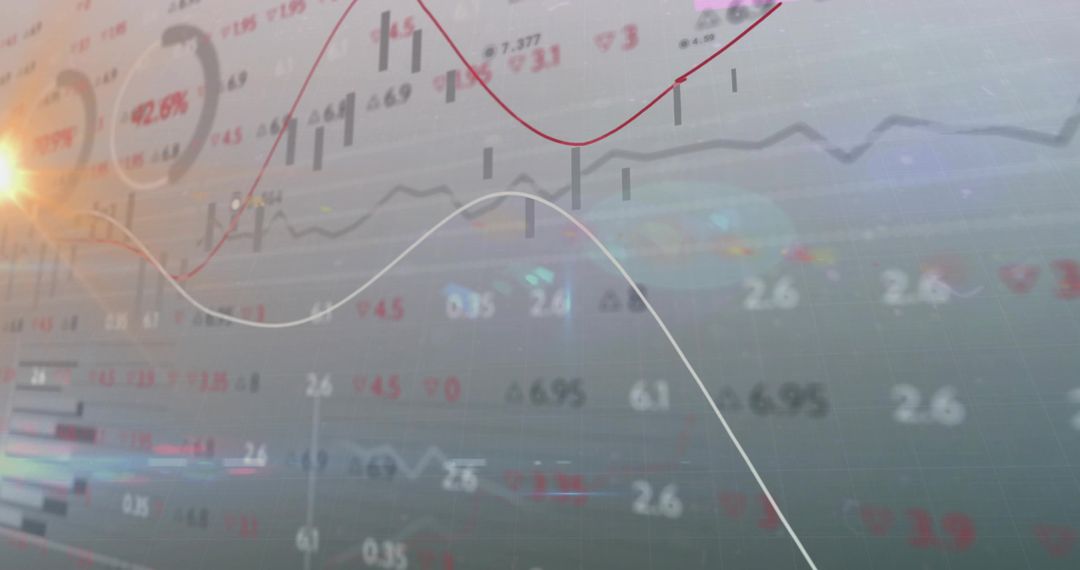
- Abstract Digital Financial Data with Moving Light Trails
Abstract Digital Financial Data with Moving Light Trails Image

Depicting digital financial processing with light trails and numerical data, this concept is ideal for representing global finance and technology. The visualization is suitable for websites, presentations, and articles about stock market analysis, fintech, and data processing innovations.
Powered by  - Get 15% off with code: PIKWIZARD15


2
downloads
downloads
Tags:
More
Credit Photo
If you would like to credit the Photo, here are some ways you can do so
Text Link
photo Link
<span class="text-link">
<span>
<a target="_blank" href=https://pikwizard.com/photo/abstract-digital-financial-data-with-moving-light-trails/9e0c8012081e229027f318422d96e7f1/>PikWizard</a>
</span>
</span>
<span class="image-link">
<span
style="margin: 0 0 20px 0; display: inline-block; vertical-align: middle; width: 100%;"
>
<a
target="_blank"
href="https://pikwizard.com/photo/abstract-digital-financial-data-with-moving-light-trails/9e0c8012081e229027f318422d96e7f1/"
style="text-decoration: none; font-size: 10px; margin: 0;"
>
<img src="https://pikwizard.com/pw/medium/9e0c8012081e229027f318422d96e7f1.jpg" style="margin: 0; width: 100%;" alt="" />
<p style="font-size: 12px; margin: 0;">PikWizard</p>
</a>
</span>
</span>
Free (free of charge)
Free for personal and commercial use.
Author: People Creations
Similar Free Stock Images

Premium


Premium


Premium


Premium


Premium


Premium


Premium


Premium


Premium


Premium


Premium


Premium


Premium


Premium


Premium


Premium


Premium


Premium


Premium


Premium


Premium


Premium


Premium


Premium