- Home >
- Stock Photos >
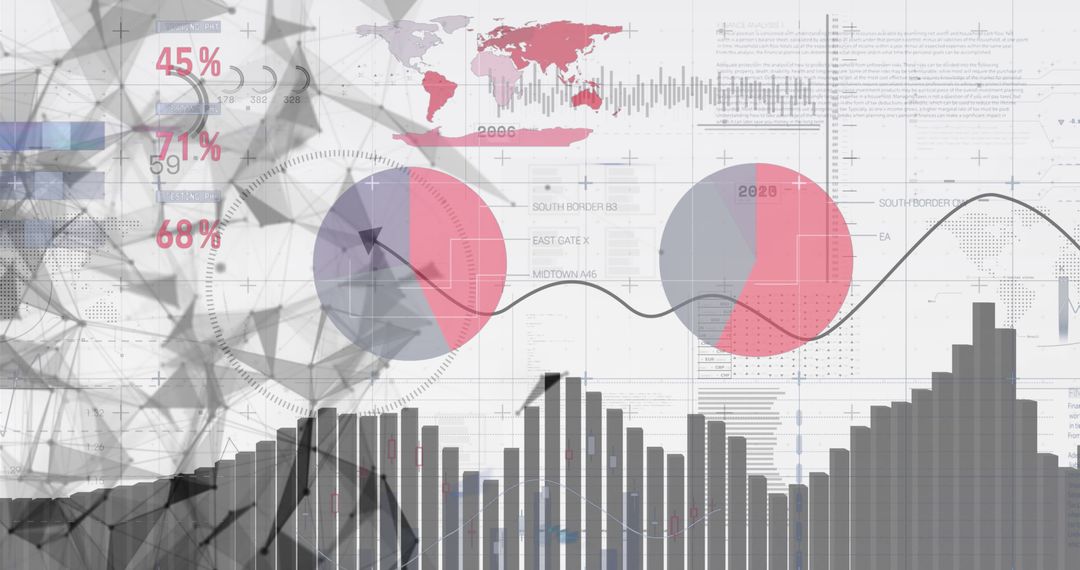
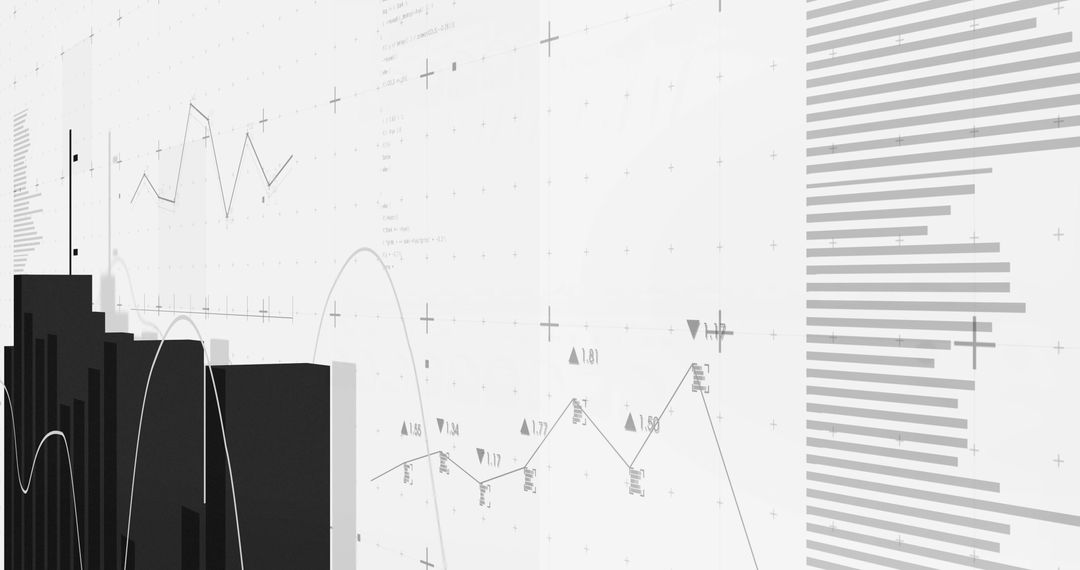
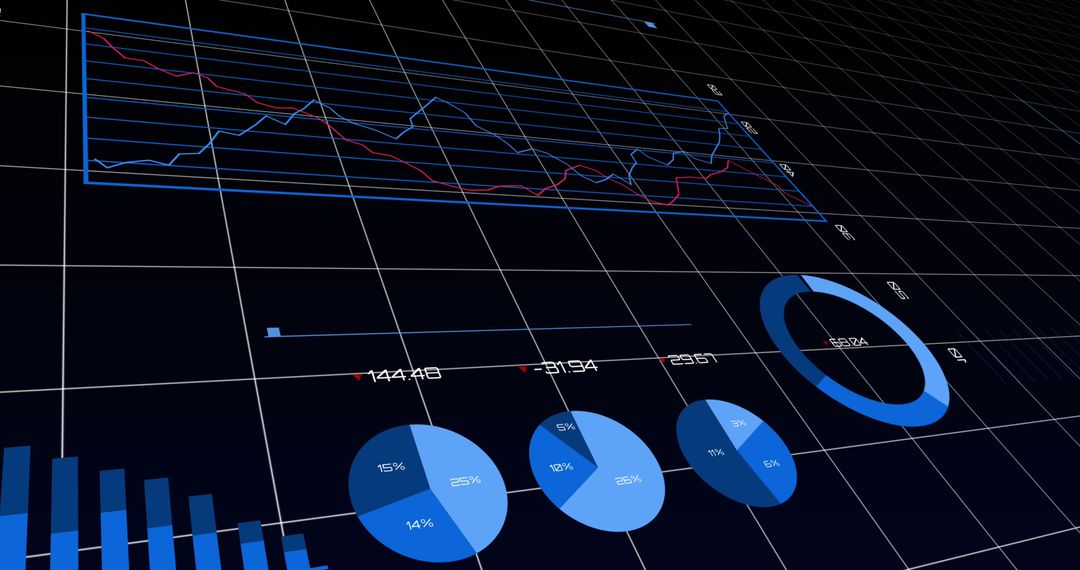
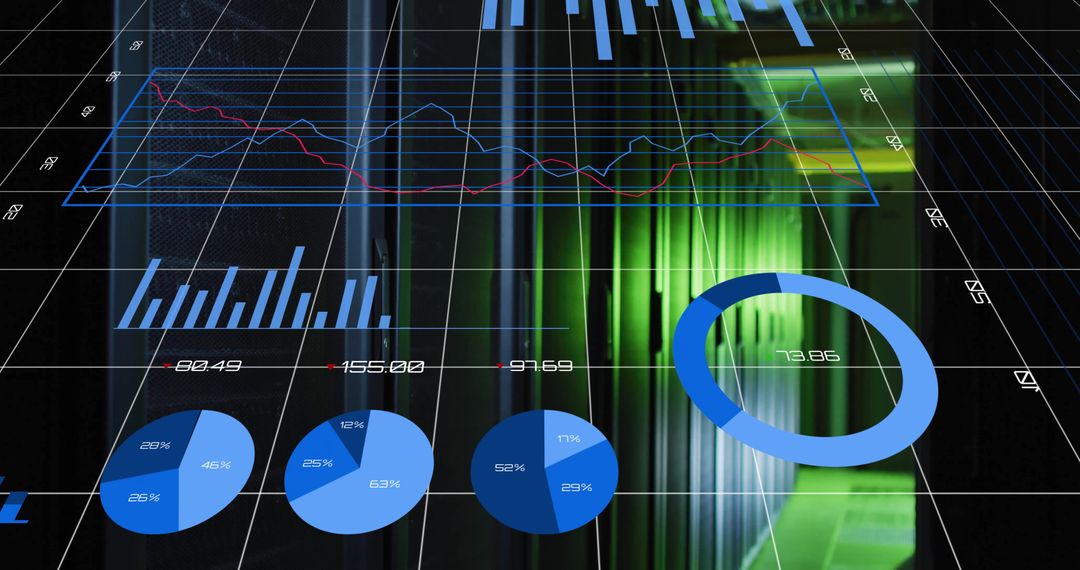
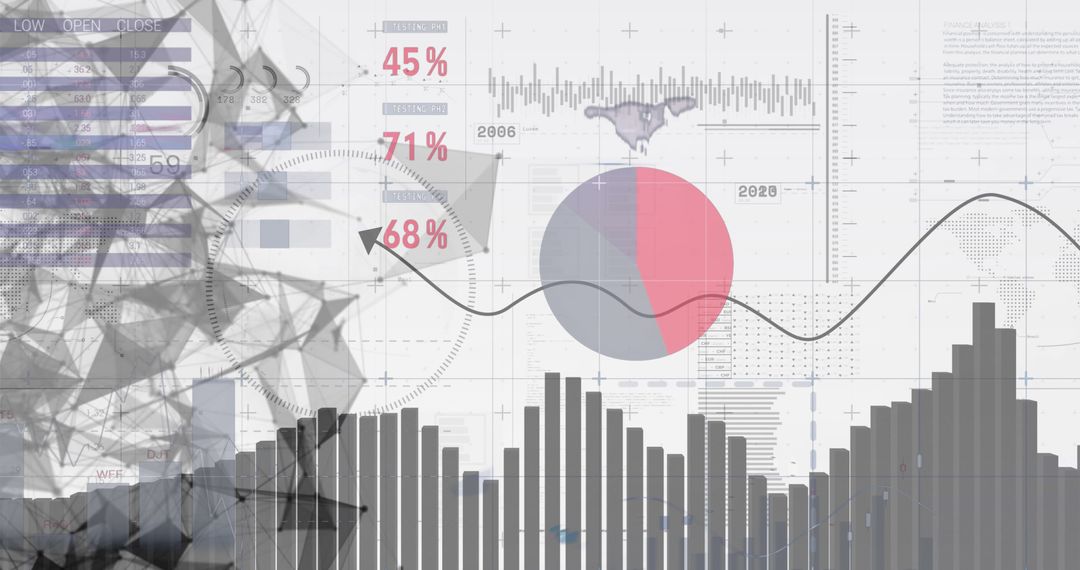
- Abstract Digital Graph Displaying Financial Growth Trends and Analysis
Abstract Digital Graph Displaying Financial Growth Trends and Analysis Image

Graph depicts abstract financial growth across various data points on dynamic background. Useful for illustrating economic, investment, and fintech concepts. Ideal for presentations, articles, infographics on finance and technology sectors.
Powered by  - Get 15% off with code: PIKWIZARD15


0
downloads
downloads
Tags:
More
Credit Photo
If you would like to credit the Photo, here are some ways you can do so
Text Link
photo Link
<span class="text-link">
<span>
<a target="_blank" href=https://pikwizard.com/photo/abstract-digital-graph-displaying-financial-growth-trends-and-analysis/c4f415906be4a4950a1b3eb50558fd1f/>PikWizard</a>
</span>
</span>
<span class="image-link">
<span
style="margin: 0 0 20px 0; display: inline-block; vertical-align: middle; width: 100%;"
>
<a
target="_blank"
href="https://pikwizard.com/photo/abstract-digital-graph-displaying-financial-growth-trends-and-analysis/c4f415906be4a4950a1b3eb50558fd1f/"
style="text-decoration: none; font-size: 10px; margin: 0;"
>
<img src="https://pikwizard.com/pw/medium/c4f415906be4a4950a1b3eb50558fd1f.jpg" style="margin: 0; width: 100%;" alt="" />
<p style="font-size: 12px; margin: 0;">PikWizard</p>
</a>
</span>
</span>
Free (free of charge)
Free for personal and commercial use.
Author: Creative Art
Similar Free Stock Images

Premium


Premium


Premium


Premium


Premium


Premium


Premium


Premium


Premium


Premium


Premium


Premium


Premium


Premium


Premium


Premium


Premium


Premium


Premium


Premium


Premium


Premium


Premium


Premium