- Home >
- Stock Photos >
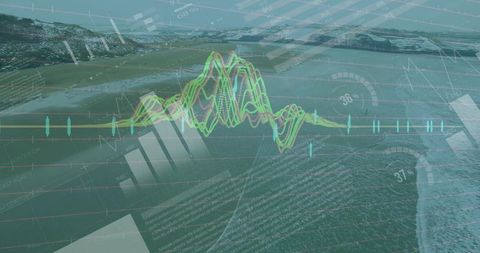
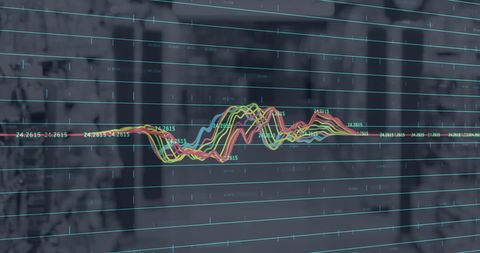
- Abstract Digital Graph with Fluctuating Connectivity Lines
Abstract Digital Graph with Fluctuating Connectivity Lines Image

This image presents an abstract visualization of digital data through fluctuating lines and geometric shapes against a dark backdrop. The combination of network patterns and grid outlines results in a compelling graphic suited for contexts related to technology, data analytics, and futuristic designs. Use this visually striking depiction as a background for presentations, technology blogs, or cyber-themed media.

downloads
Tags:
More
Credit Photo
If you would like to credit the Photo, here are some ways you can do so
Text Link
photo Link
<span class="text-link">
<span>
<a target="_blank" href=https://pikwizard.com/photo/abstract-digital-graph-with-fluctuating-connectivity-lines/ddb3832cab2aa78532b3433891c64101/>PikWizard</a>
</span>
</span>
<span class="image-link">
<span
style="margin: 0 0 20px 0; display: inline-block; vertical-align: middle; width: 100%;"
>
<a
target="_blank"
href="https://pikwizard.com/photo/abstract-digital-graph-with-fluctuating-connectivity-lines/ddb3832cab2aa78532b3433891c64101/"
style="text-decoration: none; font-size: 10px; margin: 0;"
>
<img src="https://pikwizard.com/pw/medium/ddb3832cab2aa78532b3433891c64101.jpg" style="margin: 0; width: 100%;" alt="" />
<p style="font-size: 12px; margin: 0;">PikWizard</p>
</a>
</span>
</span>
Free (free of charge)
Free for personal and commercial use.
Author: Awesome Content