
- Home >
- Stock Photos >
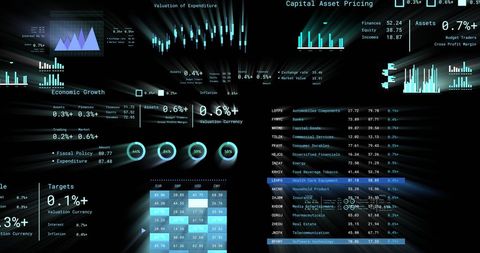
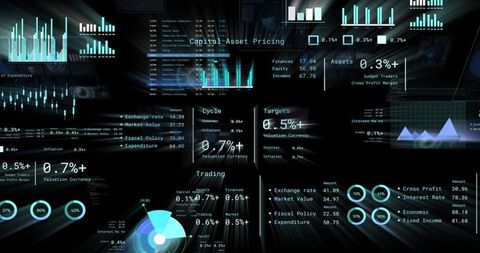
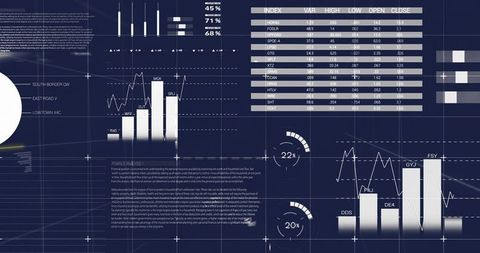
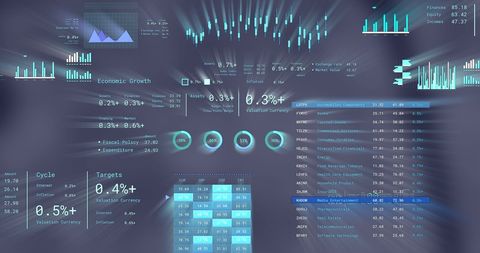
- Abstract Digital Graphs and Financial Data Visualization Interface
Abstract Digital Graphs and Financial Data Visualization Interface Image

This vibrant visual features an array of digital graphs, charts, and financial data overlaid on a dark background. It symbolizes cutting-edge business analytics or financial forecasting, perfect for illustrating topics in market trends, economic analysis, or technology transformation. Ideal for use in presentations, reports, websites, or articles related to finance, business intelligence, and data-driven decision-making.
Powered by 


downloads
Tags:
More
Credit Photo
If you would like to credit the Photo, here are some ways you can do so
Text Link
photo Link
<span class="text-link">
<span>
<a target="_blank" href=https://pikwizard.com/photo/abstract-digital-graphs-and-financial-data-visualization-interface/4402f5520973851cf00443cef3b71f03/>PikWizard</a>
</span>
</span>
<span class="image-link">
<span
style="margin: 0 0 20px 0; display: inline-block; vertical-align: middle; width: 100%;"
>
<a
target="_blank"
href="https://pikwizard.com/photo/abstract-digital-graphs-and-financial-data-visualization-interface/4402f5520973851cf00443cef3b71f03/"
style="text-decoration: none; font-size: 10px; margin: 0;"
>
<img src="https://pikwizard.com/pw/medium/4402f5520973851cf00443cef3b71f03.jpg" style="margin: 0; width: 100%;" alt="" />
<p style="font-size: 12px; margin: 0;">PikWizard</p>
</a>
</span>
</span>
Free (free of charge)
Free for personal and commercial use.
Author: People Creations
Similar Free Stock Images

Premium


Premium

Premium


Premium


Premium


Premium


Premium


Premium

Premium

Premium

Premium


Premium


Premium


Premium

Premium


Premium


Premium


Premium


Premium


Premium


Premium


Premium


Premium


Premium


Premium


Explore More Free Stock Images