- Home >
- Stock Photos >
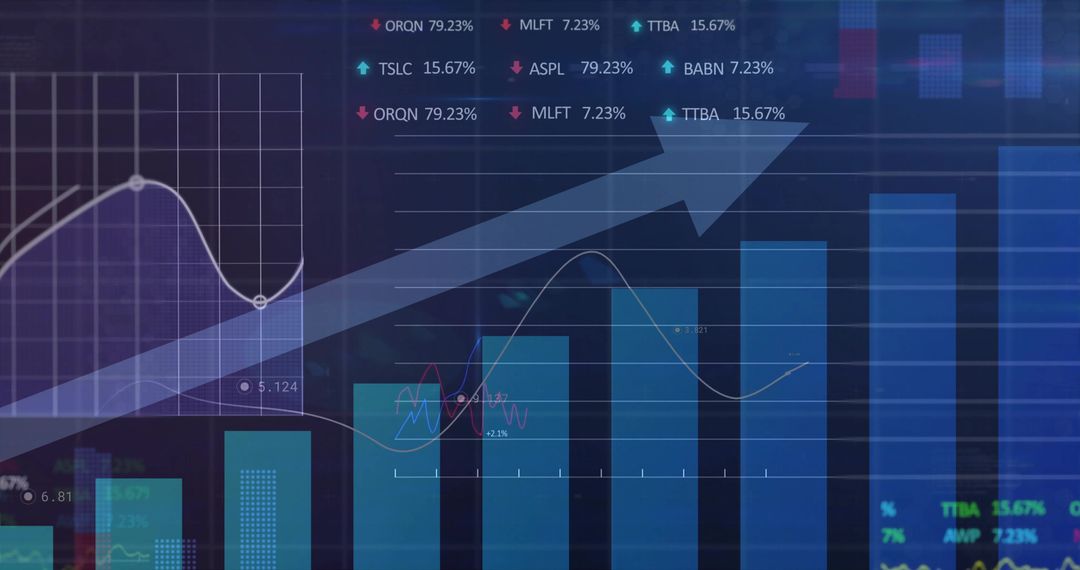
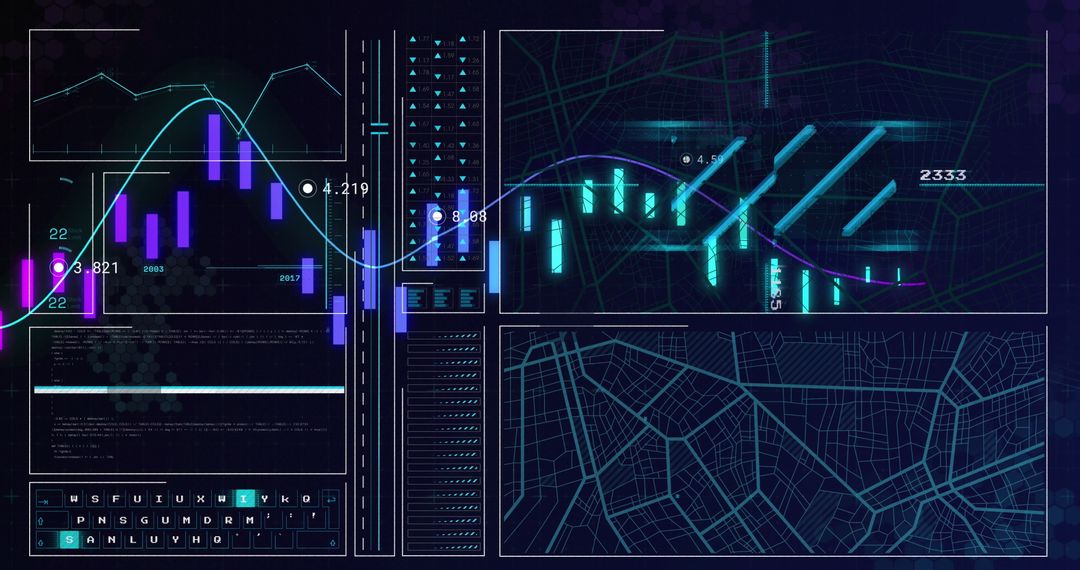
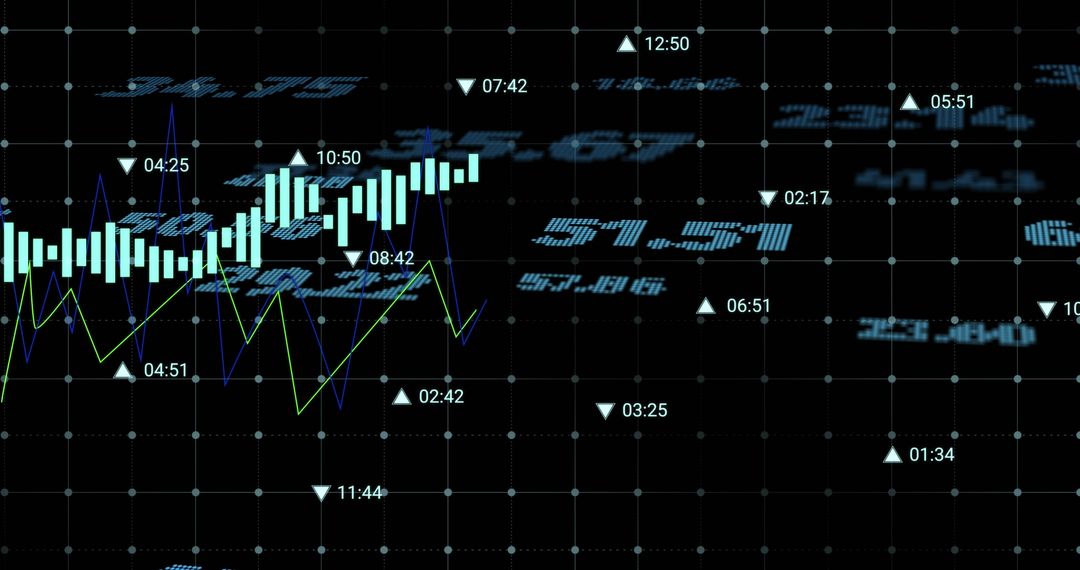
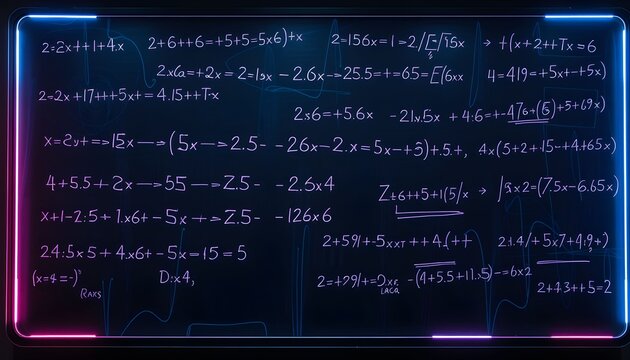
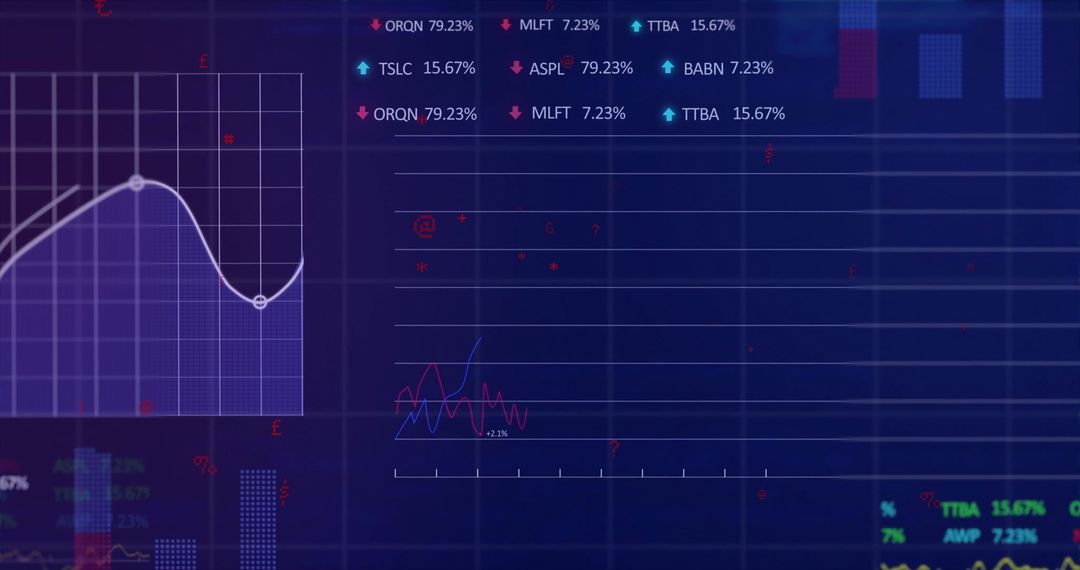
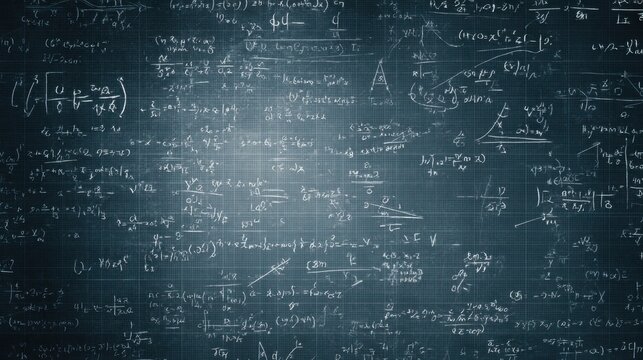
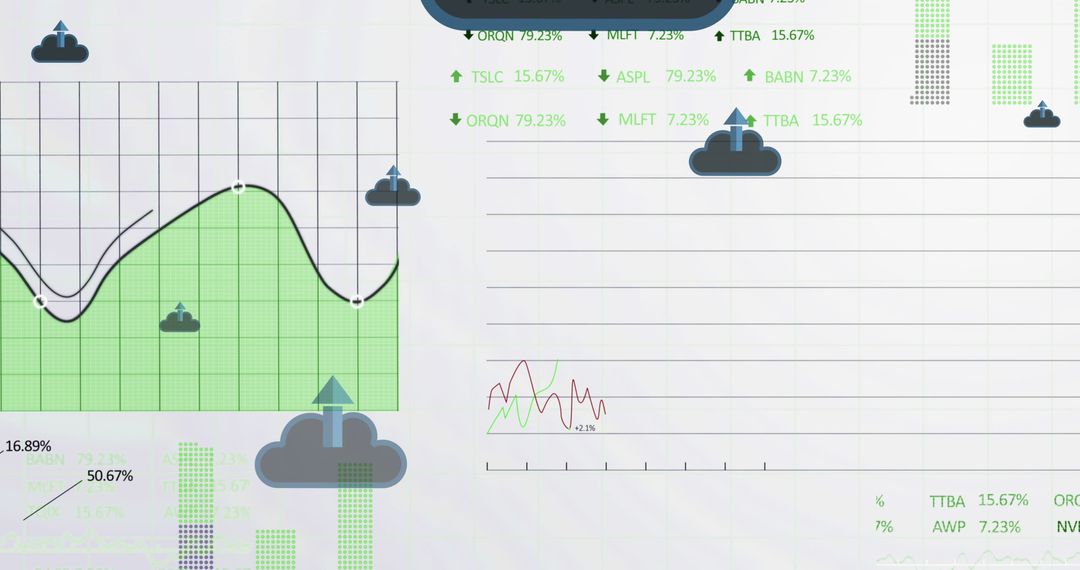
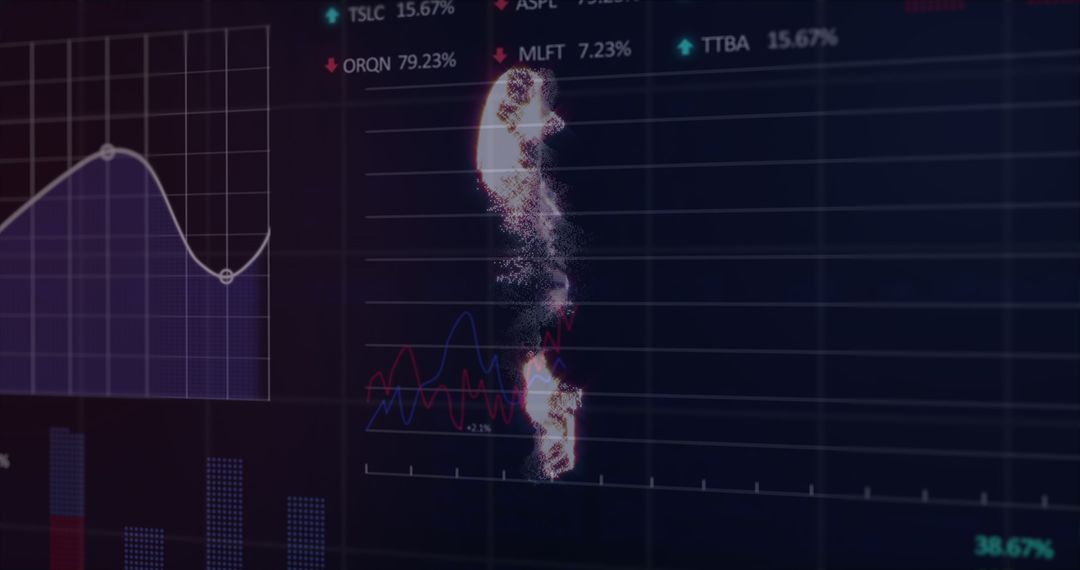
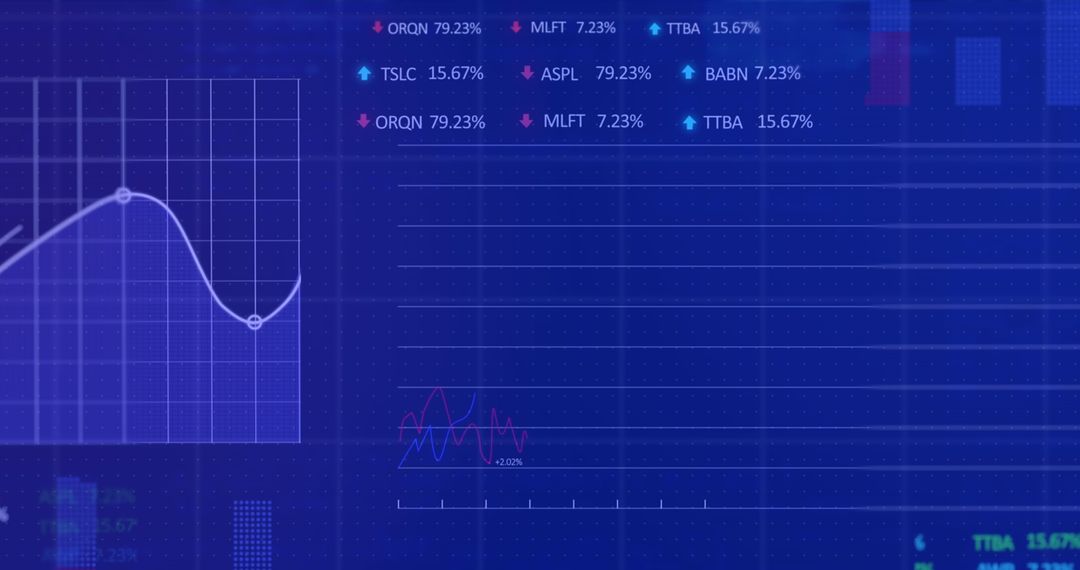
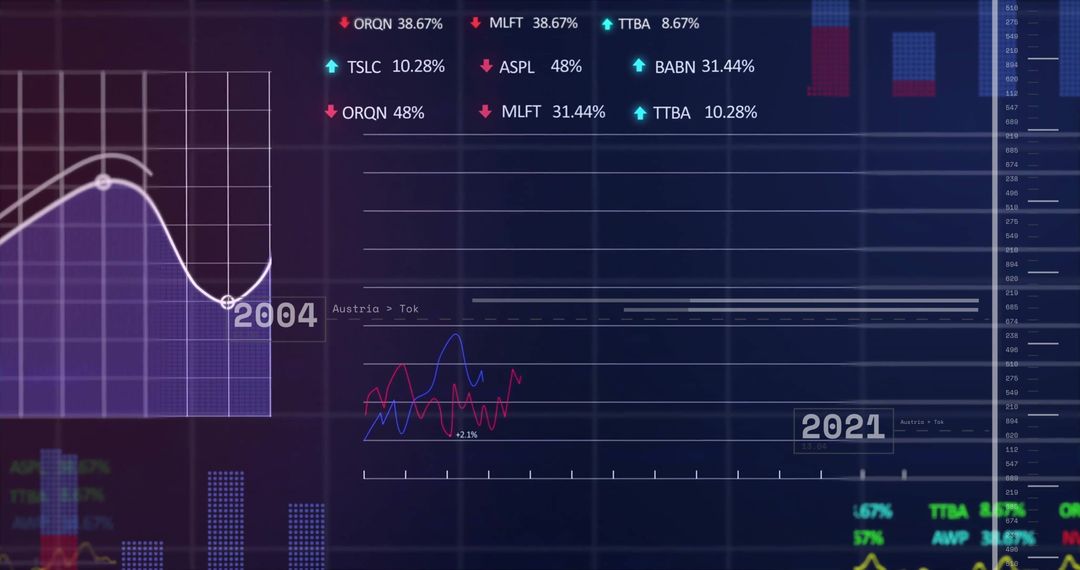
- Abstract Digital Graphs and Math Formulas Overlay on Dark Background
Abstract Digital Graphs and Math Formulas Overlay on Dark Background Image
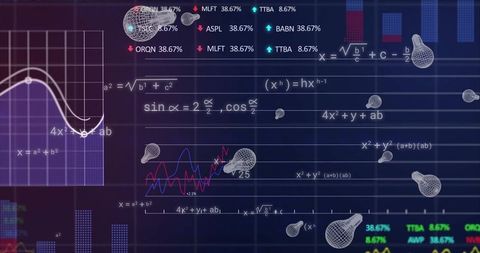
Abstract visualization shows combination of digital data, graphs, and mathematical formulas on dark background, symbolizing interaction between technology and analytics. Blue background highlighted with light-colored graphs and equations creatively illustrates data processing together with mathematical knowledge. Useful for technology-themed concepts, educational materials, data analysis visuals, and science presentations, highlighting connection between mathematics and computing world.
Powered by 


2
downloads
downloads
Tags:
More
Credit Photo
If you would like to credit the Photo, here are some ways you can do so
Text Link
photo Link
<span class="text-link">
<span>
<a target="_blank" href=https://pikwizard.com/photo/abstract-digital-graphs-and-math-formulas-overlay-on-dark-background/a04092c1bfbbe1b0cbe1ad799651c20d/>PikWizard</a>
</span>
</span>
<span class="image-link">
<span
style="margin: 0 0 20px 0; display: inline-block; vertical-align: middle; width: 100%;"
>
<a
target="_blank"
href="https://pikwizard.com/photo/abstract-digital-graphs-and-math-formulas-overlay-on-dark-background/a04092c1bfbbe1b0cbe1ad799651c20d/"
style="text-decoration: none; font-size: 10px; margin: 0;"
>
<img src="https://pikwizard.com/pw/medium/a04092c1bfbbe1b0cbe1ad799651c20d.jpg" style="margin: 0; width: 100%;" alt="" />
<p style="font-size: 12px; margin: 0;">PikWizard</p>
</a>
</span>
</span>
Free (free of charge)
Free for personal and commercial use.
Author: People Creations
Similar Free Stock Images

Premium


Premium


Premium


Premium


Premium


Premium


Premium


Premium


Premium


Premium


Premium


Premium


Premium


Premium


Premium


Premium


Premium


Premium


Premium


Premium


Premium


Premium


Premium


Premium