
- Home >
- Stock Photos >
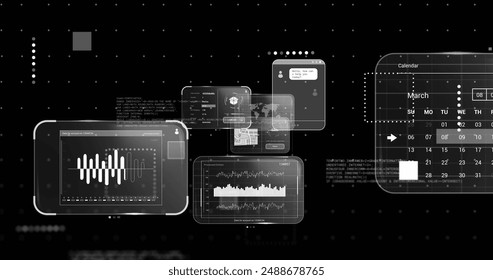
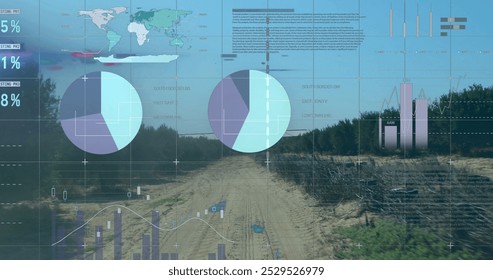
- Abstract Digital Interface with Dynamic Graphs and Charts
Abstract Digital Interface with Dynamic Graphs and Charts Image

This illustration showcases a digital interface filled with dynamic graphs, charts, and colorful data visualizations. Ideal for conveying themes of global business, technology, analytics, and finance. Can be used in presentations, reports, and marketing materials to emphasize innovation and data-driven decision making.
Powered by  - Get 15% off with code: PIKWIZARD15


downloads
Tags:
More
Credit Photo
If you would like to credit the Photo, here are some ways you can do so
Text Link
photo Link
<span class="text-link">
<span>
<a target="_blank" href=https://pikwizard.com/photo/abstract-digital-interface-with-dynamic-graphs-and-charts/139ae56378ac065aadb02f1a4e2d3e71/>PikWizard</a>
</span>
</span>
<span class="image-link">
<span
style="margin: 0 0 20px 0; display: inline-block; vertical-align: middle; width: 100%;"
>
<a
target="_blank"
href="https://pikwizard.com/photo/abstract-digital-interface-with-dynamic-graphs-and-charts/139ae56378ac065aadb02f1a4e2d3e71/"
style="text-decoration: none; font-size: 10px; margin: 0;"
>
<img src="https://pikwizard.com/pw/medium/139ae56378ac065aadb02f1a4e2d3e71.jpg" style="margin: 0; width: 100%;" alt="" />
<p style="font-size: 12px; margin: 0;">PikWizard</p>
</a>
</span>
</span>
Free (free of charge)
Free for personal and commercial use.
Author: Creative Art
Similar Free Stock Images

Premium


Premium


Premium


Premium


Premium


Premium


Premium


Premium

Premium

Premium


Premium


Premium


Premium


Premium


Premium


Premium


Premium


Premium


Premium


Premium


Premium


Premium


Premium


Premium


Premium


Explore More Free Stock Images