- Home >
- Stock Photos >
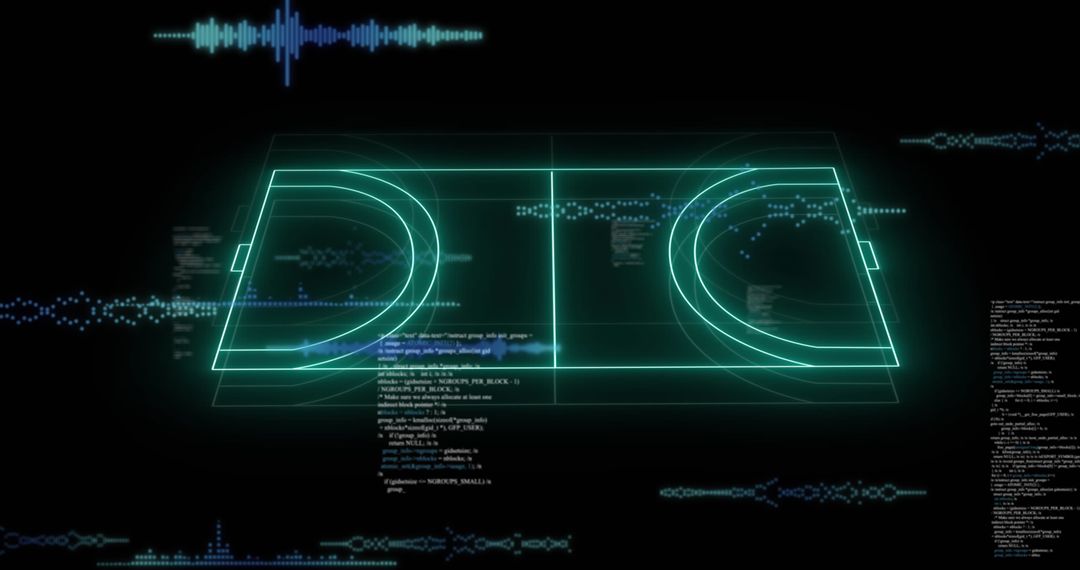
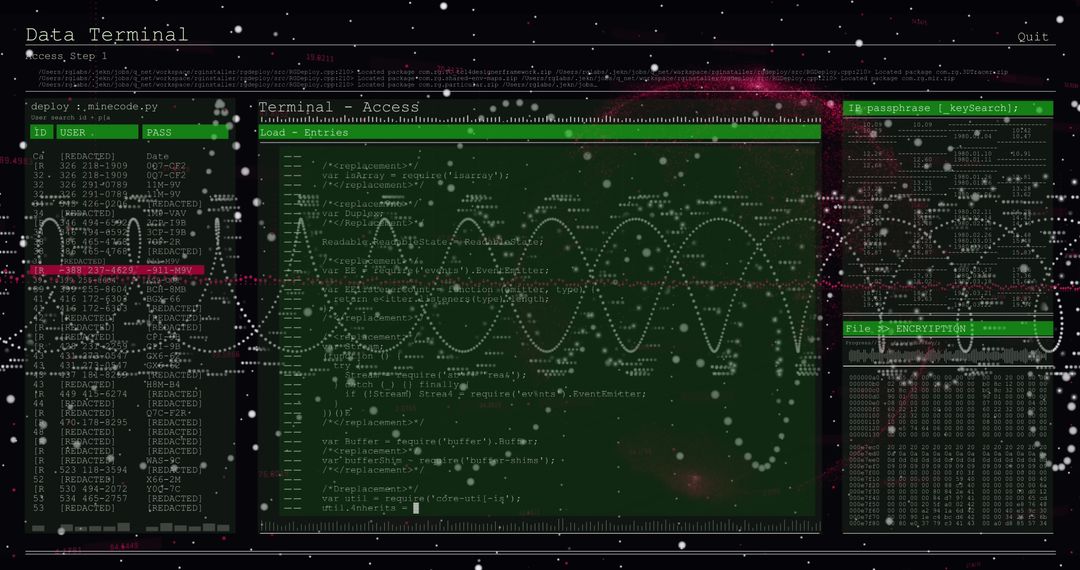
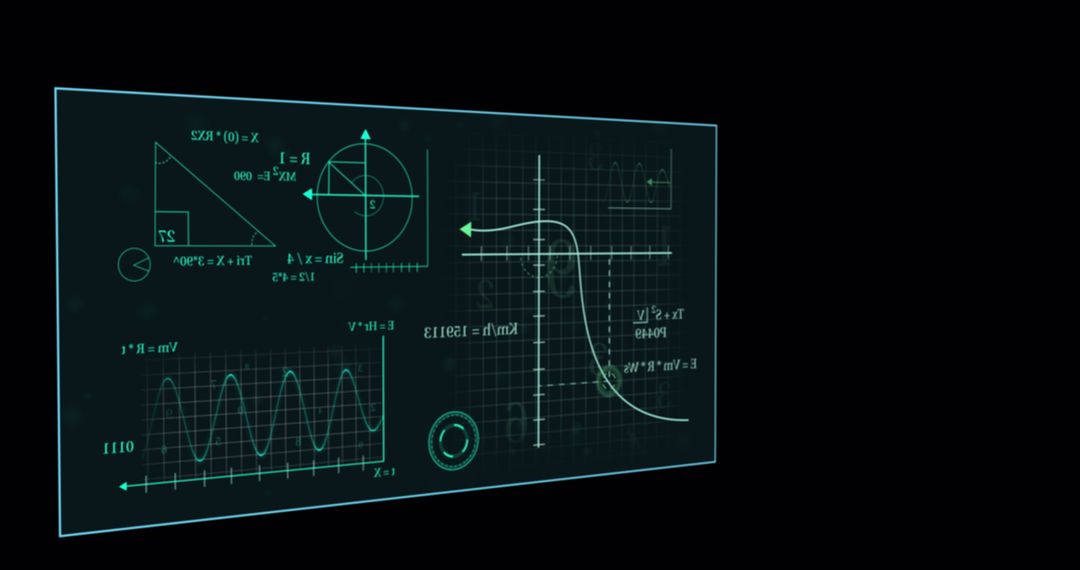
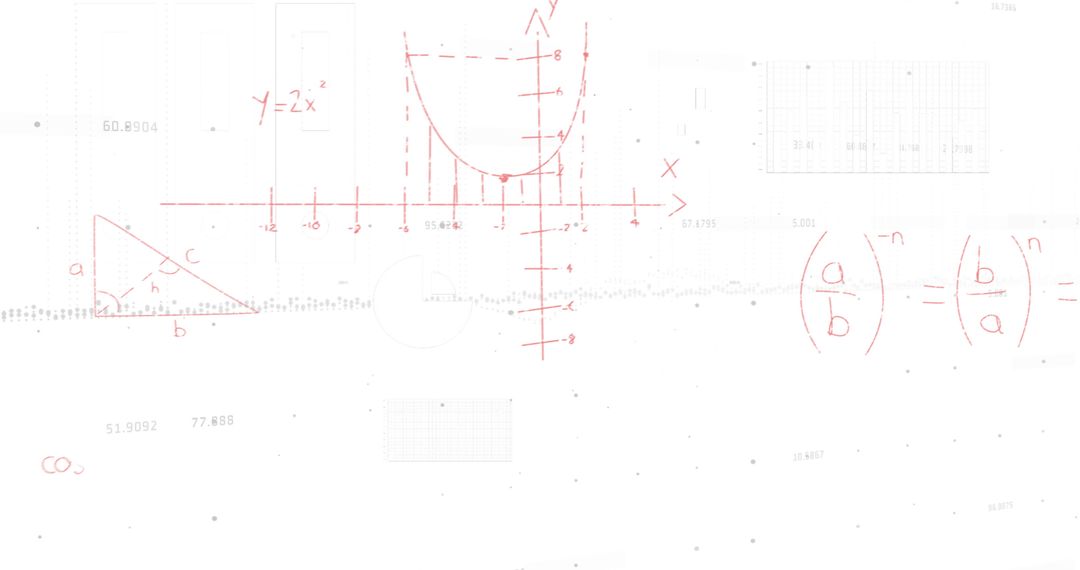
- Abstract Digital Interface with Mathematical Equations and Graphs on Black Background
Abstract Digital Interface with Mathematical Equations and Graphs on Black Background Image
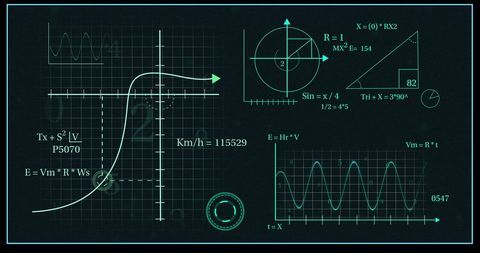
This conceptual illustration features mathematical equations and graphs intersecting a dark grid layout. The arrangement evokes themes of scientific analysis and technological advancement, ideal for projects focused on education, science education, and digital innovations. The image can be used in electronics webinars to enhance presentations, as a cutting-edge wallpaper, or for tech-related marketing materials.
Powered by 


2
downloads
downloads
Tags:
More
Credit Photo
If you would like to credit the Photo, here are some ways you can do so
Text Link
photo Link
<span class="text-link">
<span>
<a target="_blank" href=https://pikwizard.com/photo/abstract-digital-interface-with-mathematical-equations-and-graphs-on-black-background/6d6c4324f026450d91dd184a4b4a991a/>PikWizard</a>
</span>
</span>
<span class="image-link">
<span
style="margin: 0 0 20px 0; display: inline-block; vertical-align: middle; width: 100%;"
>
<a
target="_blank"
href="https://pikwizard.com/photo/abstract-digital-interface-with-mathematical-equations-and-graphs-on-black-background/6d6c4324f026450d91dd184a4b4a991a/"
style="text-decoration: none; font-size: 10px; margin: 0;"
>
<img src="https://pikwizard.com/pw/medium/6d6c4324f026450d91dd184a4b4a991a.jpg" style="margin: 0; width: 100%;" alt="" />
<p style="font-size: 12px; margin: 0;">PikWizard</p>
</a>
</span>
</span>
Free (free of charge)
Free for personal and commercial use.
Author: Awesome Content
Similar Free Stock Images
Premium


Premium


Premium


Premium


Premium


Premium


Premium


Premium


Premium


Premium


Premium


Premium


Premium


Premium


Premium


Premium


Premium


Premium


Premium


Premium


Premium


Premium


Premium


Premium