- Home >
- Stock Photos >
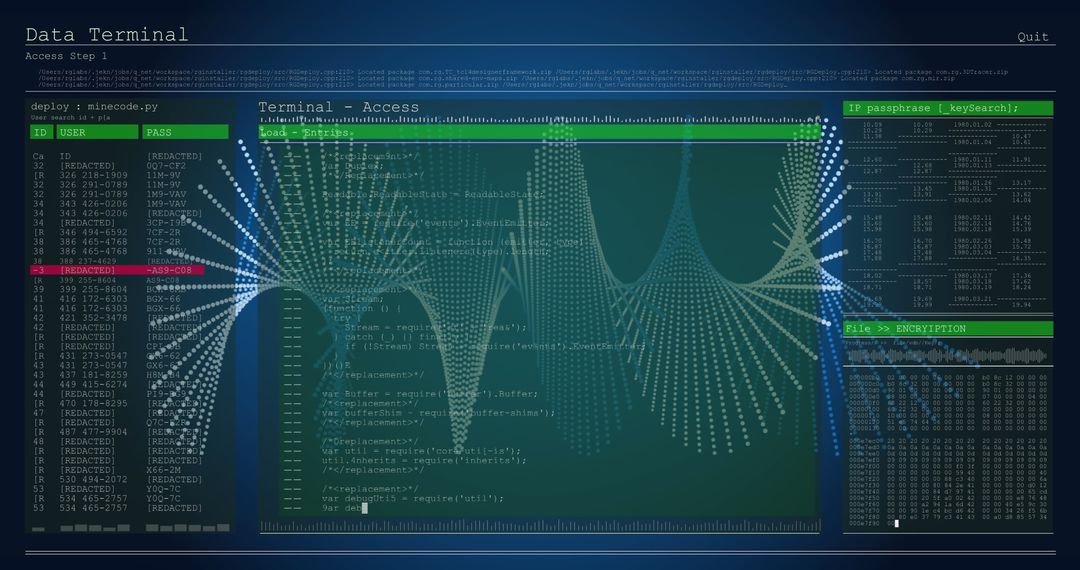
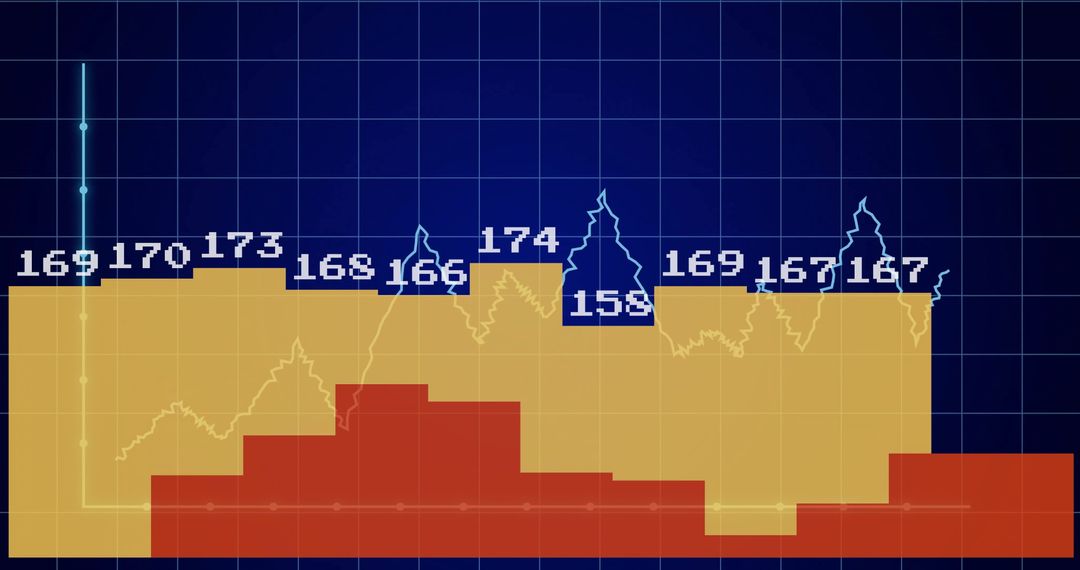
- Abstract Digital Stock Market Analysis with Graphs
Abstract Digital Stock Market Analysis with Graphs Image

Colorful abstract graphics blend with stock market data charts. Ideal for illustrating market trends or business reports highlighting financial growth or economic insights. Suitable for corporations aiming to convey strategic analysis, economic reviews, or digital trading platforms in modern and innovative designs.
Powered by  - Get 15% off with code: PIKWIZARD15


2
downloads
downloads
Tags:
More
Credit Photo
If you would like to credit the Photo, here are some ways you can do so
Text Link
photo Link
<span class="text-link">
<span>
<a target="_blank" href=https://pikwizard.com/photo/abstract-digital-stock-market-analysis-with-graphs/83d26a5a64827a900ed55e671ddc5f22/>PikWizard</a>
</span>
</span>
<span class="image-link">
<span
style="margin: 0 0 20px 0; display: inline-block; vertical-align: middle; width: 100%;"
>
<a
target="_blank"
href="https://pikwizard.com/photo/abstract-digital-stock-market-analysis-with-graphs/83d26a5a64827a900ed55e671ddc5f22/"
style="text-decoration: none; font-size: 10px; margin: 0;"
>
<img src="https://pikwizard.com/pw/medium/83d26a5a64827a900ed55e671ddc5f22.jpg" style="margin: 0; width: 100%;" alt="" />
<p style="font-size: 12px; margin: 0;">PikWizard</p>
</a>
</span>
</span>
Free (free of charge)
Free for personal and commercial use.
Author: Awesome Content
Similar Free Stock Images

Premium


Premium


Premium


Premium


Premium


Premium


Premium


Premium


Premium


Premium


Premium


Premium


Premium


Premium


Premium


Premium


Premium


Premium


Premium


Premium


Premium


Premium


Premium


Premium