- Home >
- Stock Photos >
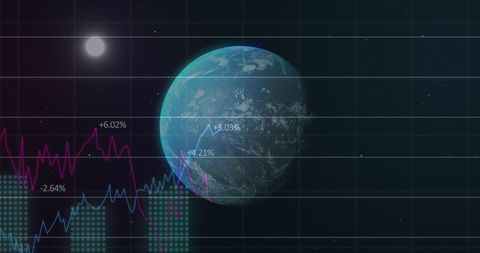
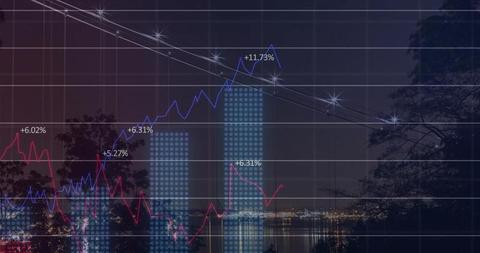
- Abstract Digital Wave with Financial Data Visualization
Abstract Digital Wave with Financial Data Visualization Image

Dynamic visualization displaying integration of stock market data with a digital wave, paying homage to modern financial analytics. Inspirational for finance blogs, technology articles, and education materials about economic trends and innovation.

downloads
Tags:
More
Credit Photo
If you would like to credit the Photo, here are some ways you can do so
Text Link
photo Link
<span class="text-link">
<span>
<a target="_blank" href=https://pikwizard.com/photo/abstract-digital-wave-with-financial-data-visualization/4e4ab2d5f1be9d3a006e0840b2eb6348/>PikWizard</a>
</span>
</span>
<span class="image-link">
<span
style="margin: 0 0 20px 0; display: inline-block; vertical-align: middle; width: 100%;"
>
<a
target="_blank"
href="https://pikwizard.com/photo/abstract-digital-wave-with-financial-data-visualization/4e4ab2d5f1be9d3a006e0840b2eb6348/"
style="text-decoration: none; font-size: 10px; margin: 0;"
>
<img src="https://pikwizard.com/pw/medium/4e4ab2d5f1be9d3a006e0840b2eb6348.jpg" style="margin: 0; width: 100%;" alt="" />
<p style="font-size: 12px; margin: 0;">PikWizard</p>
</a>
</span>
</span>
Free (free of charge)
Free for personal and commercial use.
Author: People Creations