- Home >
- Stock Photos >
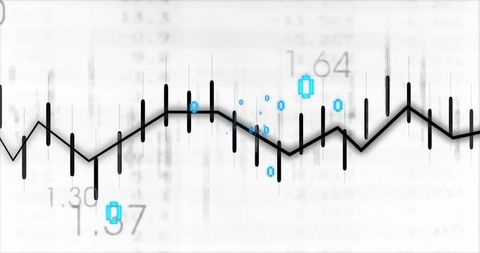
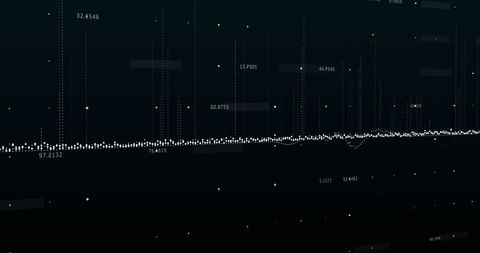
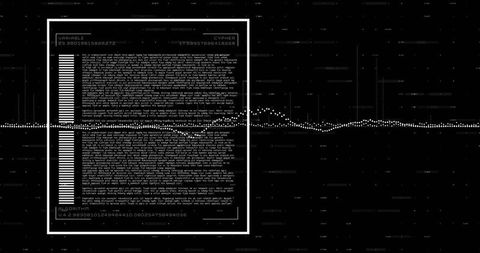
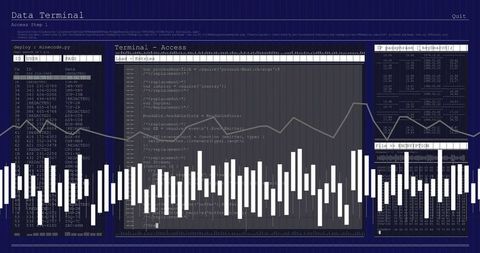
- Abstract Digital Waveform in Data Processing Visualization
Abstract Digital Waveform in Data Processing Visualization Image

Abstract visual depiction of data processing with bright digital waveforms overlaid on a dark background. Technology elements and interconnected lines suggest advanced digital interfaces and global business dynamics. Useful for illustrating concepts in technology, big data analytics, cybersecurity discussions, and modern software interfaces.

downloads
Tags:
More
Credit Photo
If you would like to credit the Photo, here are some ways you can do so
Text Link
photo Link
<span class="text-link">
<span>
<a target="_blank" href=https://pikwizard.com/photo/abstract-digital-waveform-in-data-processing-visualization/2c5a23f3b9b4edad1ebd088085cec08d/>PikWizard</a>
</span>
</span>
<span class="image-link">
<span
style="margin: 0 0 20px 0; display: inline-block; vertical-align: middle; width: 100%;"
>
<a
target="_blank"
href="https://pikwizard.com/photo/abstract-digital-waveform-in-data-processing-visualization/2c5a23f3b9b4edad1ebd088085cec08d/"
style="text-decoration: none; font-size: 10px; margin: 0;"
>
<img src="https://pikwizard.com/pw/medium/2c5a23f3b9b4edad1ebd088085cec08d.jpg" style="margin: 0; width: 100%;" alt="" />
<p style="font-size: 12px; margin: 0;">PikWizard</p>
</a>
</span>
</span>
Free (free of charge)
Free for personal and commercial use.
Author: Creative Art