- Home >
- Stock Photos >
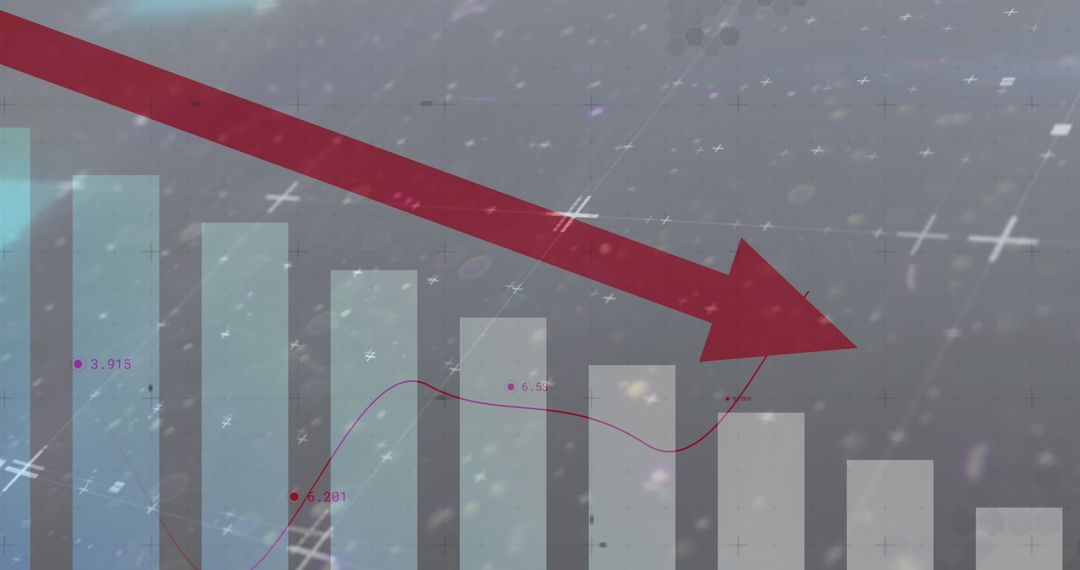
- Abstract Falling Bar Charts and Red Arrow Indicates Global Market Decline
Abstract Falling Bar Charts and Red Arrow Indicates Global Market Decline Image

Visual representation illustrating global market decline using falling bar charts and digital interface. This can be used in finance-related articles, presentations on economic trends, or to emphasize stock market analysis.
Powered by 


2
downloads
downloads
Tags:
More
Credit Photo
If you would like to credit the Photo, here are some ways you can do so
Text Link
photo Link
<span class="text-link">
<span>
<a target="_blank" href=https://pikwizard.com/photo/abstract-falling-bar-charts-and-red-arrow-indicates-global-market-decline/baaae26a738494333f3071fc64d0987f/>PikWizard</a>
</span>
</span>
<span class="image-link">
<span
style="margin: 0 0 20px 0; display: inline-block; vertical-align: middle; width: 100%;"
>
<a
target="_blank"
href="https://pikwizard.com/photo/abstract-falling-bar-charts-and-red-arrow-indicates-global-market-decline/baaae26a738494333f3071fc64d0987f/"
style="text-decoration: none; font-size: 10px; margin: 0;"
>
<img src="https://pikwizard.com/pw/medium/baaae26a738494333f3071fc64d0987f.jpg" style="margin: 0; width: 100%;" alt="" />
<p style="font-size: 12px; margin: 0;">PikWizard</p>
</a>
</span>
</span>
Free (free of charge)
Free for personal and commercial use.
Author: Creative Art
Similar Free Stock Images

Premium


Premium


Premium


Premium


Premium


Premium


Premium


Premium


Premium


Premium


Premium


Premium


Premium


Premium


Premium


Premium


Premium


Premium


Premium


Premium


Premium


Premium


Premium


Premium