- Home >
- Stock Photos >
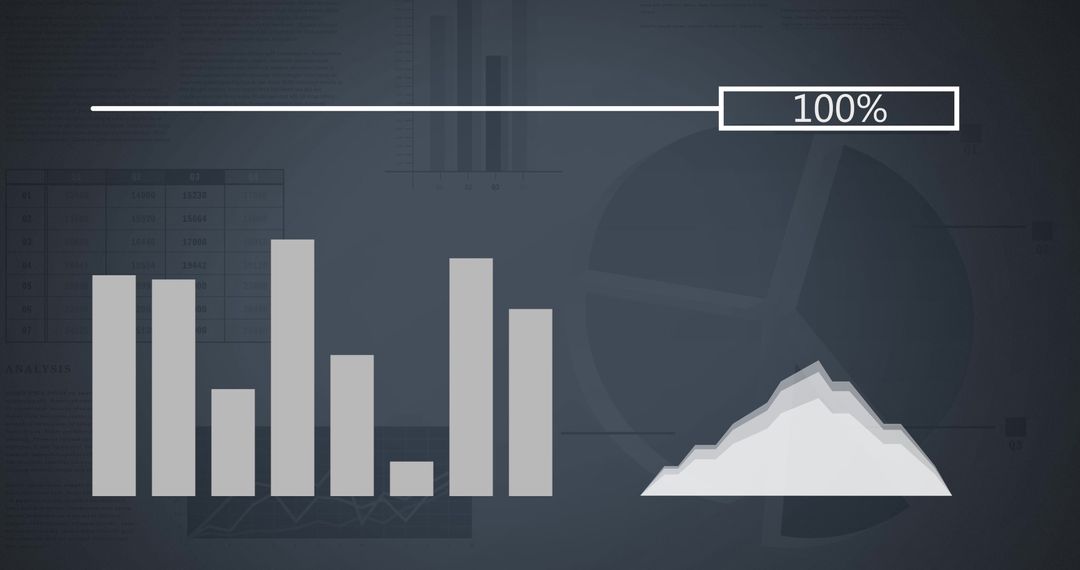
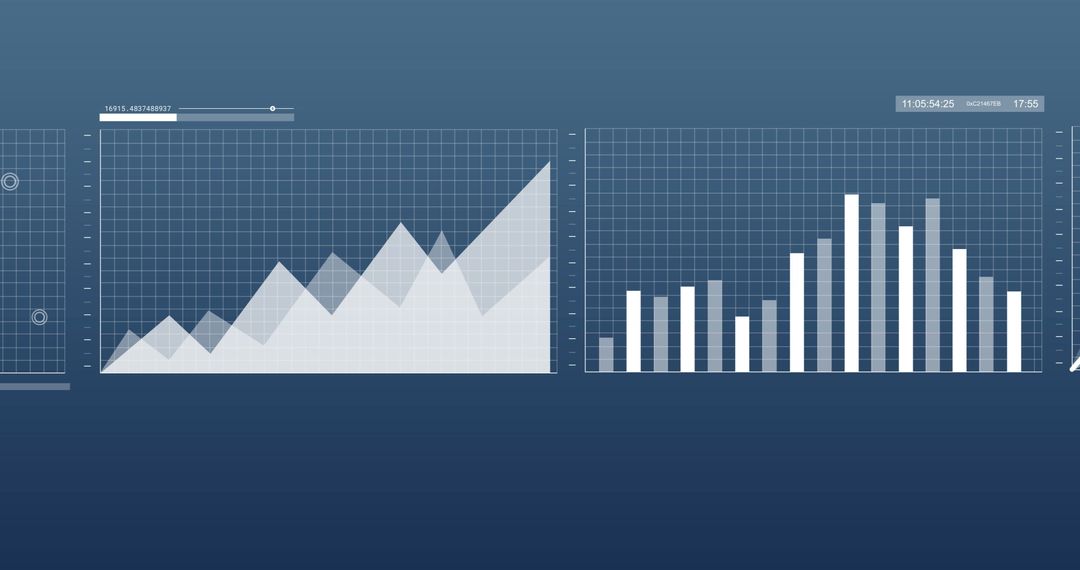
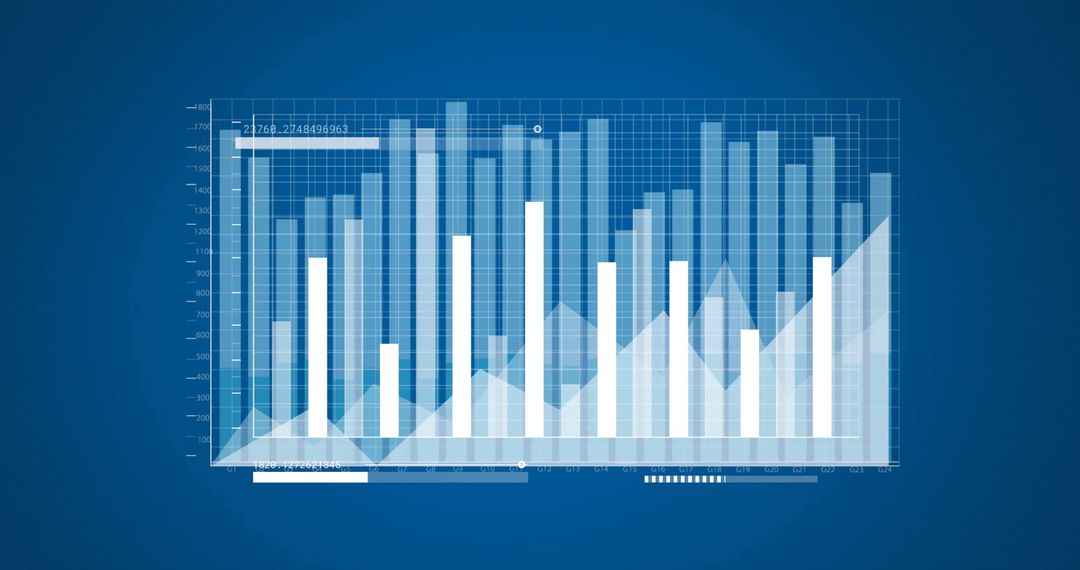
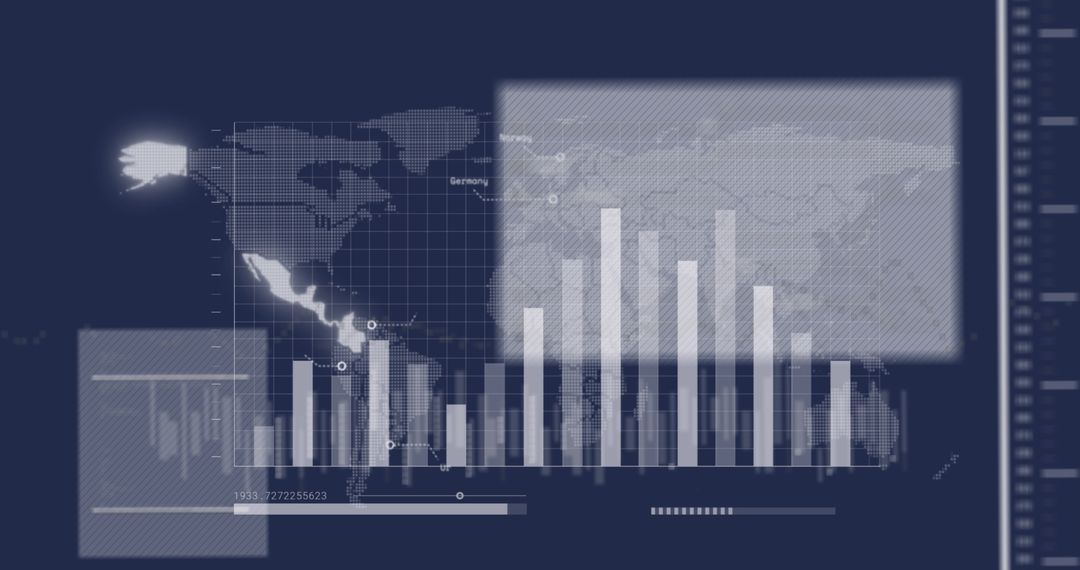
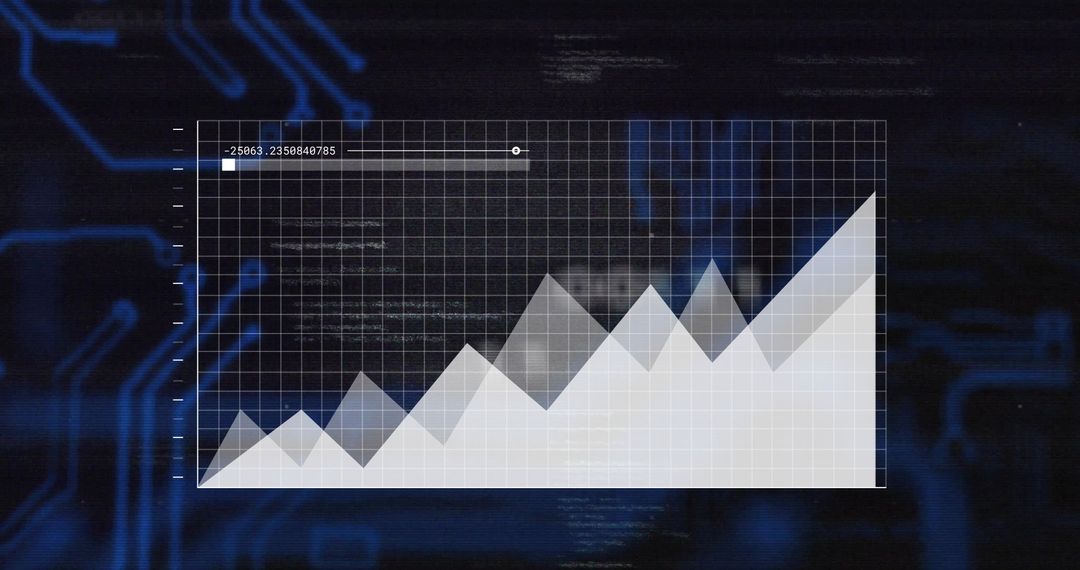
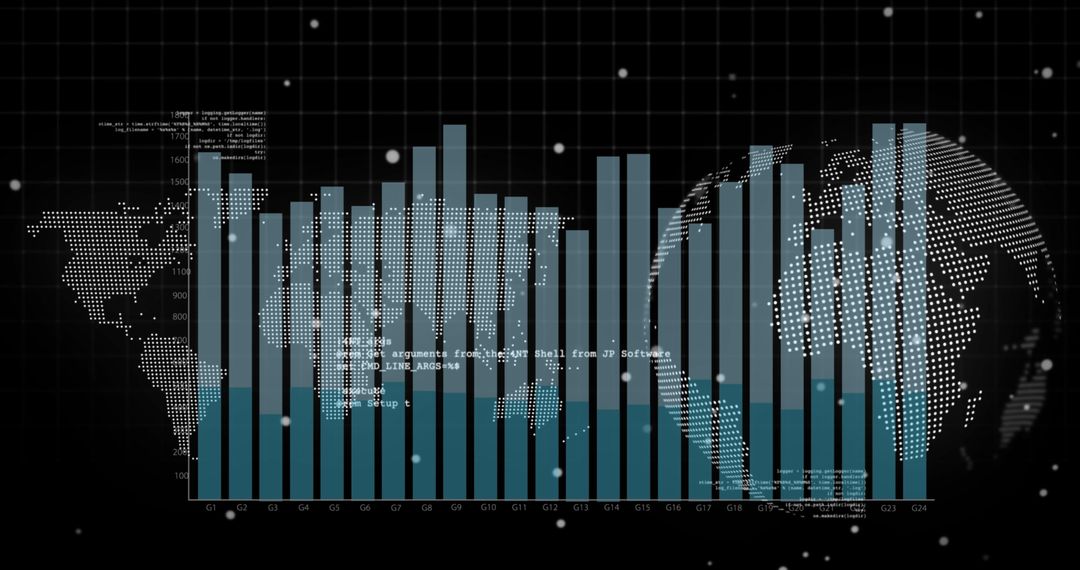
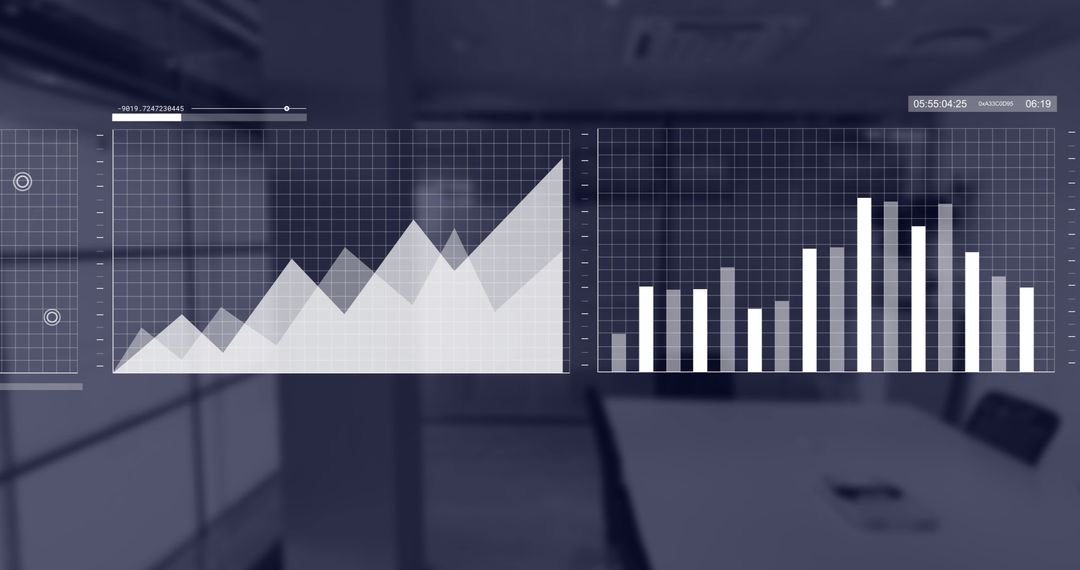
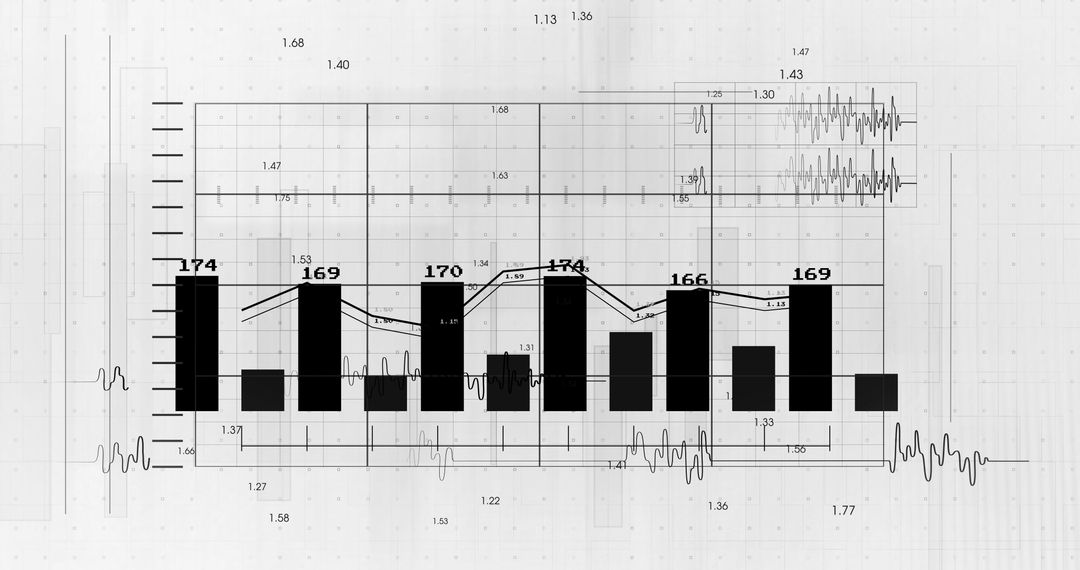
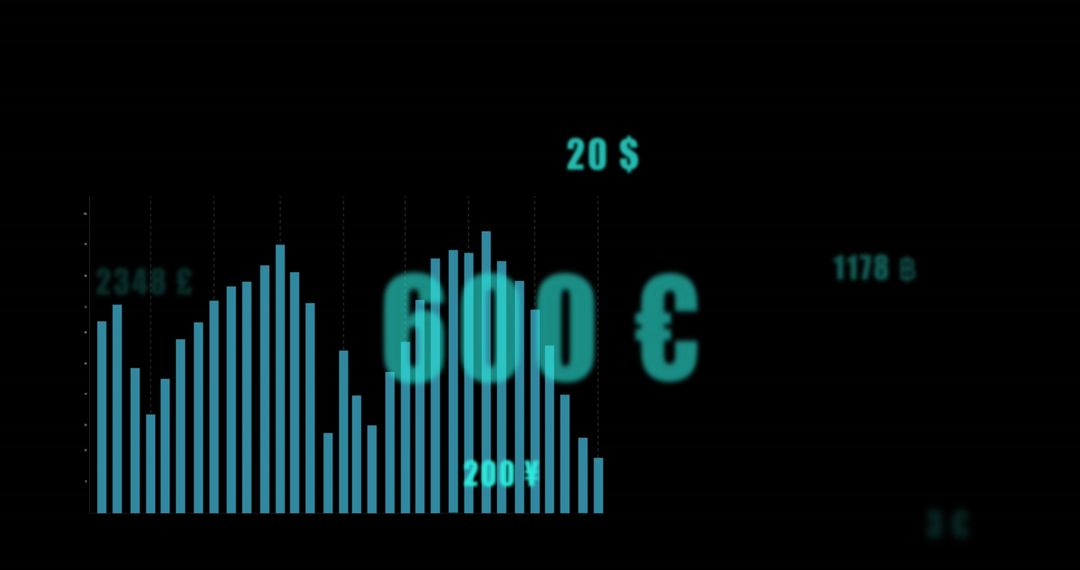
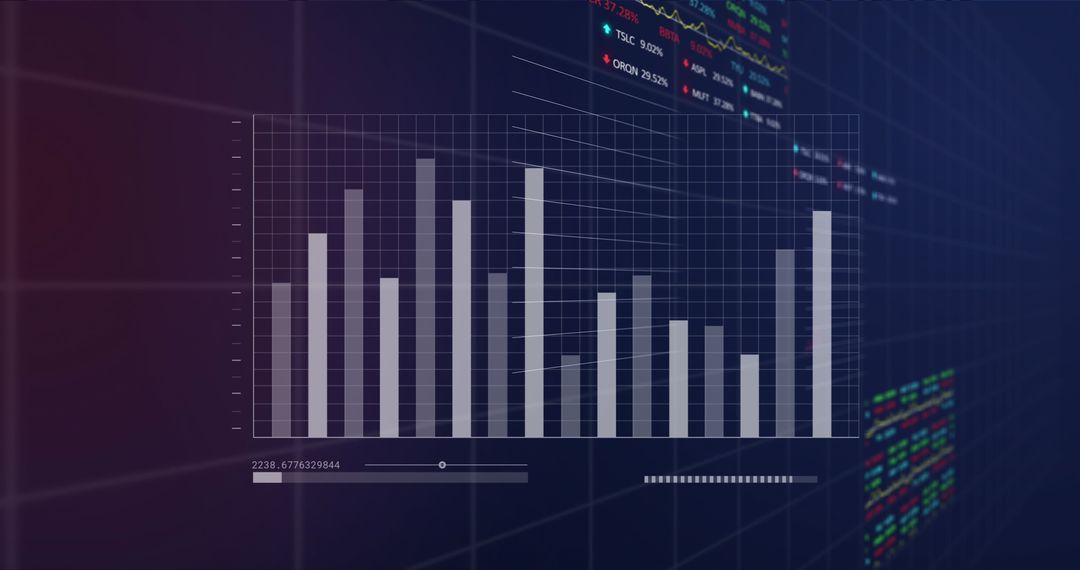
- Abstract Finance Chart with Rising Bars and Data Analysis
Abstract Finance Chart with Rising Bars and Data Analysis Image

Stylized representation of financial growth through rising bars and a line chart against dark background. Perfect for illustrating concepts of financial analysis, economic growth, or investment opportunities. Ideal for presentations, website illustrations, infographics, and educational materials related to finance or economics.
Powered by 


2
downloads
downloads
Tags:
More
Credit Photo
If you would like to credit the Photo, here are some ways you can do so
Text Link
photo Link
<span class="text-link">
<span>
<a target="_blank" href=https://pikwizard.com/photo/abstract-finance-chart-with-rising-bars-and-data-analysis/d8551f620f8eca9bc5eb7b67f69db28b/>PikWizard</a>
</span>
</span>
<span class="image-link">
<span
style="margin: 0 0 20px 0; display: inline-block; vertical-align: middle; width: 100%;"
>
<a
target="_blank"
href="https://pikwizard.com/photo/abstract-finance-chart-with-rising-bars-and-data-analysis/d8551f620f8eca9bc5eb7b67f69db28b/"
style="text-decoration: none; font-size: 10px; margin: 0;"
>
<img src="https://pikwizard.com/pw/medium/d8551f620f8eca9bc5eb7b67f69db28b.jpg" style="margin: 0; width: 100%;" alt="" />
<p style="font-size: 12px; margin: 0;">PikWizard</p>
</a>
</span>
</span>
Free (free of charge)
Free for personal and commercial use.
Author: Authentic Images
Similar Free Stock Images
Premium


Premium


Premium


Premium

Premium


Premium


Premium


Premium


Premium


Premium


Premium


Premium


Premium


Premium


Premium


Premium


Premium


Premium


Premium


Premium


Premium


Premium


Premium


Premium