
- Home >
- Stock Photos >
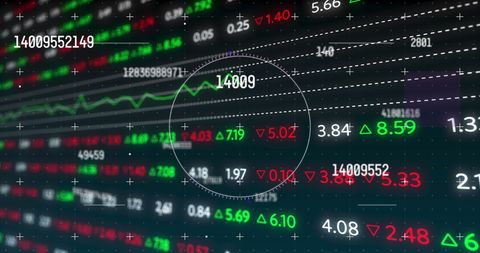
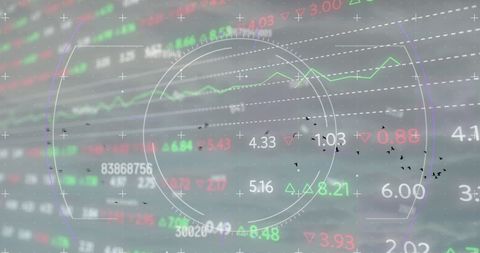
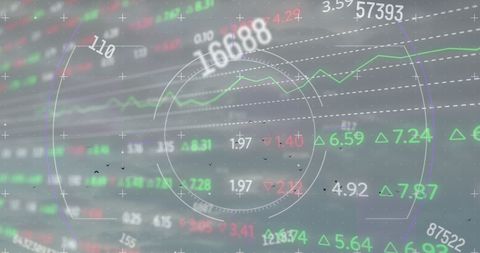
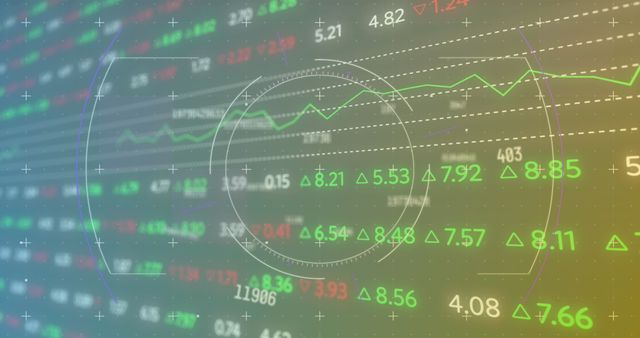
- Abstract Finance Data Analytics on Digital Screen
Abstract Finance Data Analytics on Digital Screen Image

Dynamic representation of financial data on a digital screen with a futuristic design emphasizing global finance and technology. Best used for illustrating concepts in finance, investment analysis, economy trends, and data processing in both digital and print media.
Powered by 


downloads
Tags:
More
Credit Photo
If you would like to credit the Photo, here are some ways you can do so
Text Link
photo Link
<span class="text-link">
<span>
<a target="_blank" href=https://pikwizard.com/photo/abstract-finance-data-analytics-on-digital-screen/9c81d36d1b9dc8b59c588d8e5c130fb7/>PikWizard</a>
</span>
</span>
<span class="image-link">
<span
style="margin: 0 0 20px 0; display: inline-block; vertical-align: middle; width: 100%;"
>
<a
target="_blank"
href="https://pikwizard.com/photo/abstract-finance-data-analytics-on-digital-screen/9c81d36d1b9dc8b59c588d8e5c130fb7/"
style="text-decoration: none; font-size: 10px; margin: 0;"
>
<img src="https://pikwizard.com/pw/medium/9c81d36d1b9dc8b59c588d8e5c130fb7.jpg" style="margin: 0; width: 100%;" alt="" />
<p style="font-size: 12px; margin: 0;">PikWizard</p>
</a>
</span>
</span>
Free (free of charge)
Free for personal and commercial use.
Author: Creative Art
Similar Free Stock Images

Premium


Premium


Premium


Premium


Premium


Premium

Premium


Premium


Premium


Premium


Premium


Premium

Premium


Premium


Premium


Premium


Premium

Premium


Premium

Premium


Premium


Premium


Premium


Premium

Premium


Explore More Free Stock Images