- Home >
- Stock Photos >
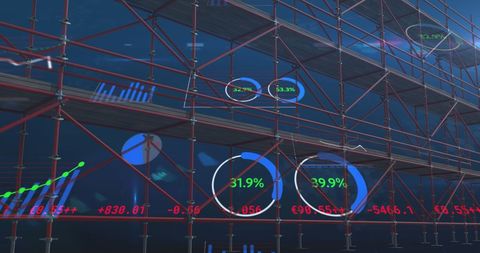
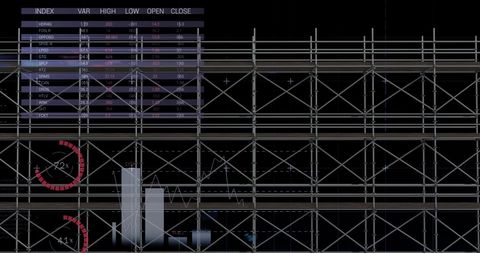
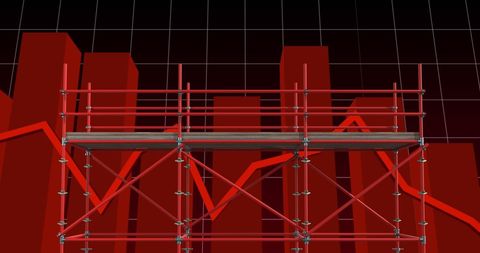
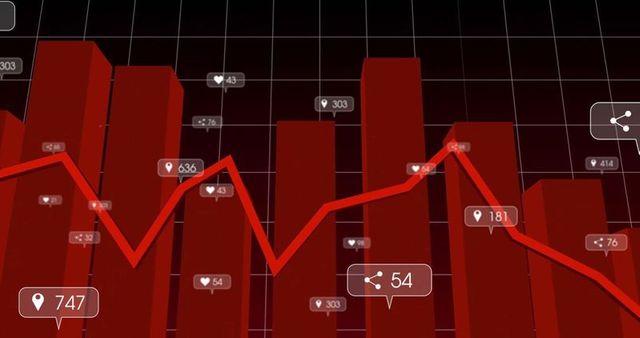
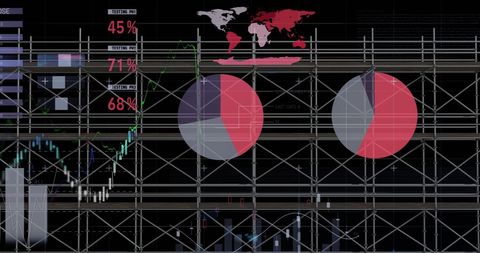
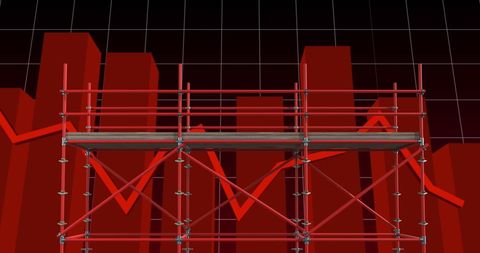
- Abstract Finance Data with Red Scaffold Conceptual Background
Abstract Finance Data with Red Scaffold Conceptual Background Image

Conceptual representation combines finance and construction elements. Red scaffolding symbolizes structural components superimposed on financial graph depicting economical trends. Useful for illustrating concepts of economic growth, market developments, construction industry data analysis, or future investment scenarios.
Powered by  - Get 15% off with code: PIKWIZARD15


2
downloads
downloads
Tags:
More
Credit Photo
If you would like to credit the Photo, here are some ways you can do so
Text Link
photo Link
<span class="text-link">
<span>
<a target="_blank" href=https://pikwizard.com/photo/abstract-finance-data-with-red-scaffold-conceptual-background/c1813bd0f21cf1758992ff785c94c901/>PikWizard</a>
</span>
</span>
<span class="image-link">
<span
style="margin: 0 0 20px 0; display: inline-block; vertical-align: middle; width: 100%;"
>
<a
target="_blank"
href="https://pikwizard.com/photo/abstract-finance-data-with-red-scaffold-conceptual-background/c1813bd0f21cf1758992ff785c94c901/"
style="text-decoration: none; font-size: 10px; margin: 0;"
>
<img src="https://pikwizard.com/pw/medium/c1813bd0f21cf1758992ff785c94c901.jpg" style="margin: 0; width: 100%;" alt="" />
<p style="font-size: 12px; margin: 0;">PikWizard</p>
</a>
</span>
</span>
Free (free of charge)
Free for personal and commercial use.
Author: Authentic Images
Similar Free Stock Images

Premium


Premium


Premium


Premium


Premium


Premium


Premium


Premium


Premium


Premium


Premium


Premium


Premium


Premium


Premium


Premium


Premium


Premium


Premium


Premium


Premium


Premium


Premium


Premium


Premium