- Home >
- Stock Photos >
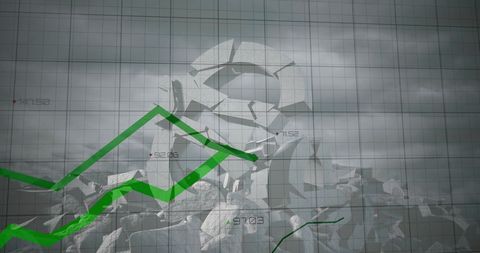
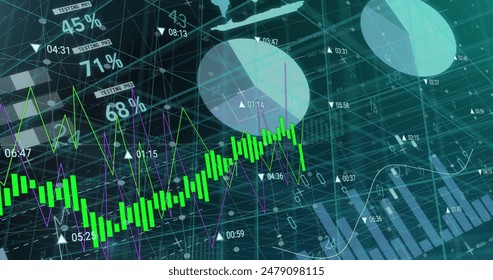
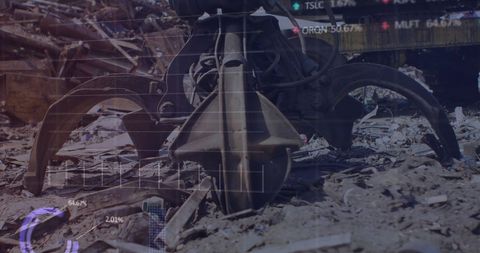
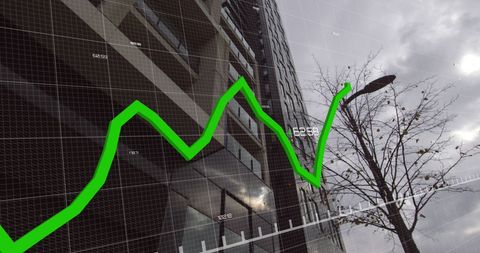
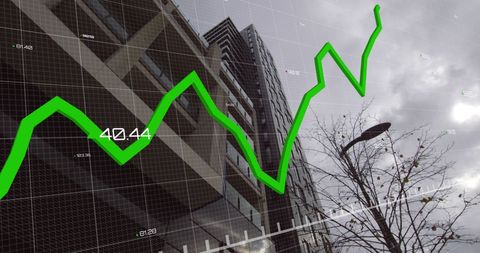
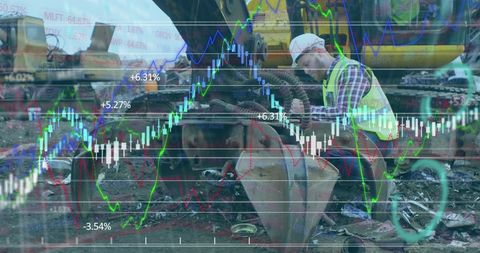
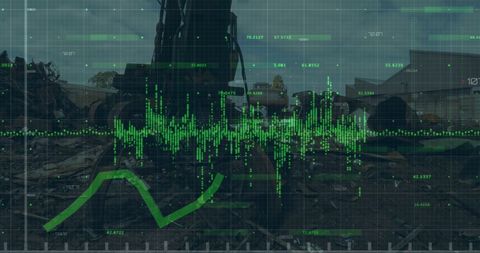
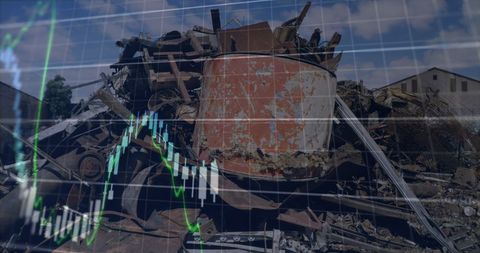
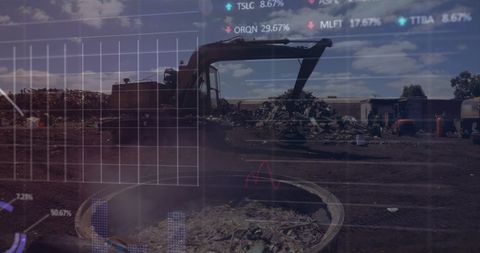
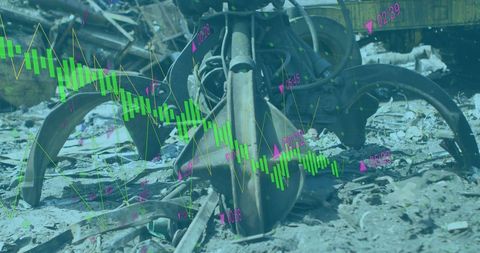
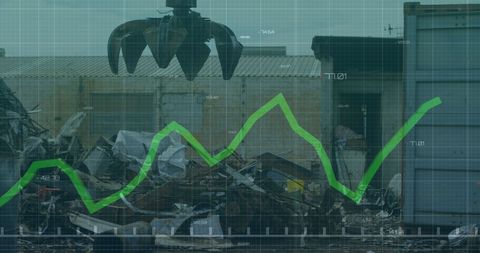
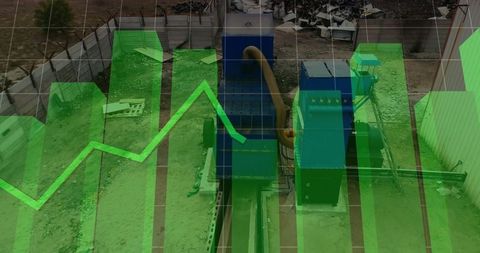
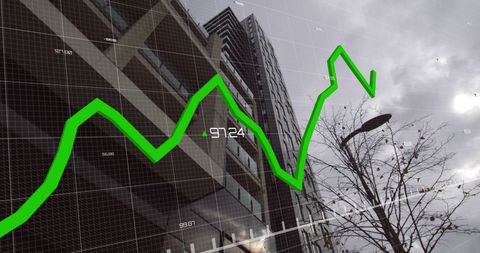
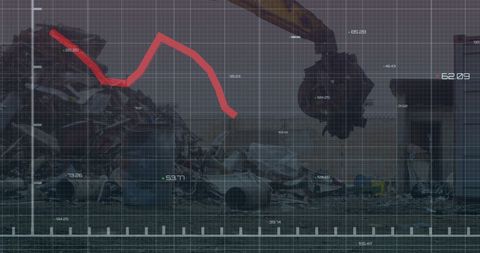
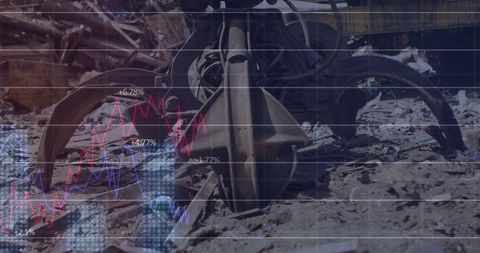
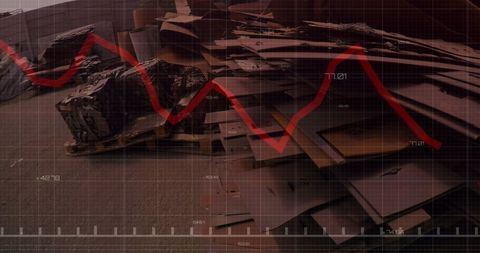
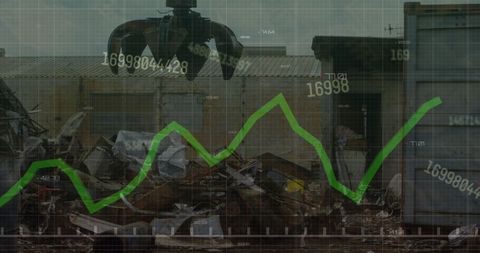
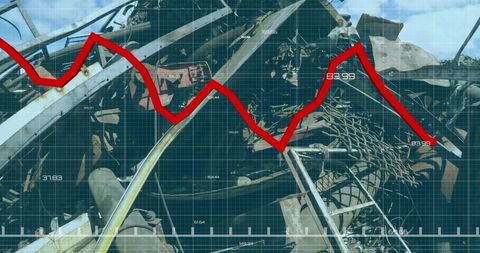
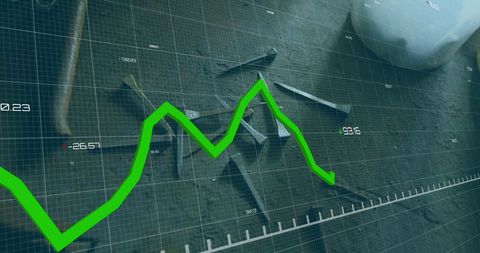
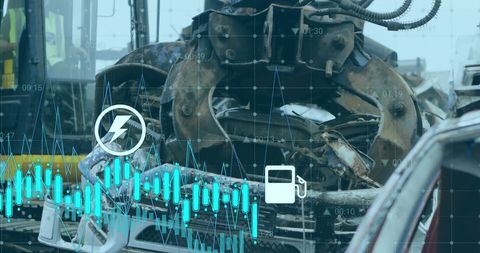
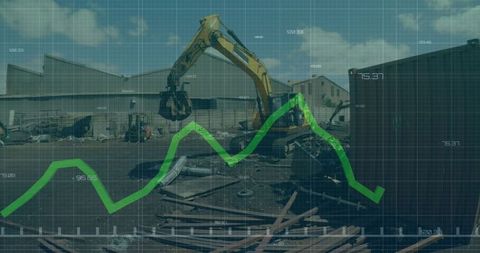
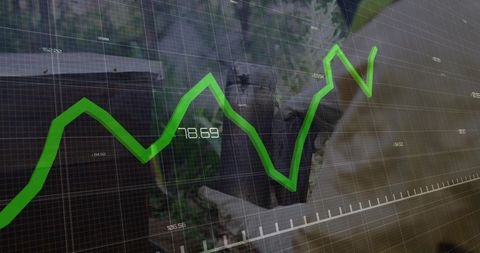
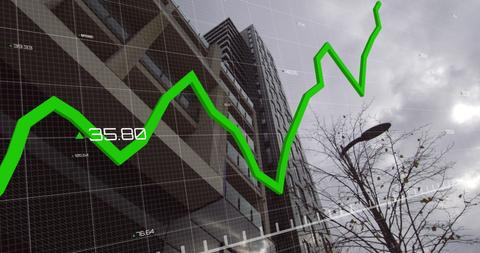
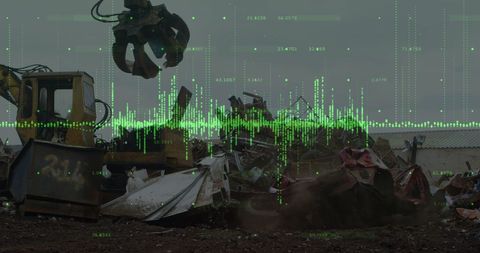
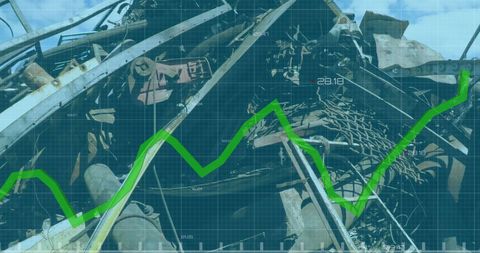
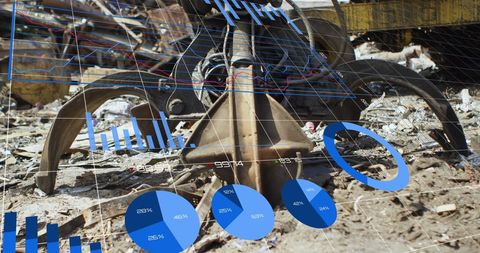
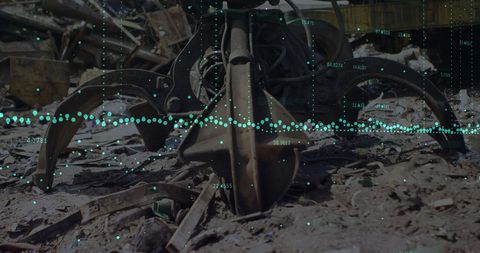
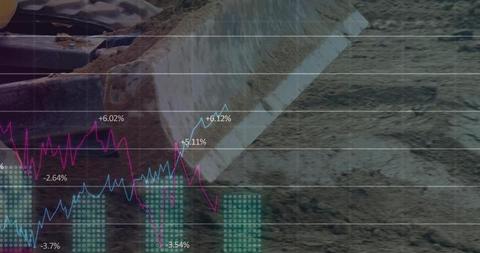
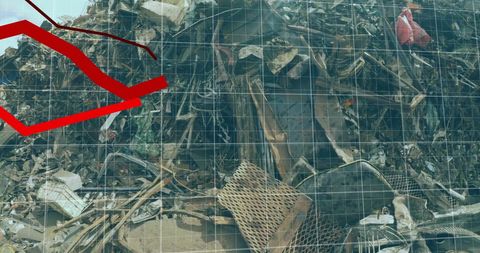
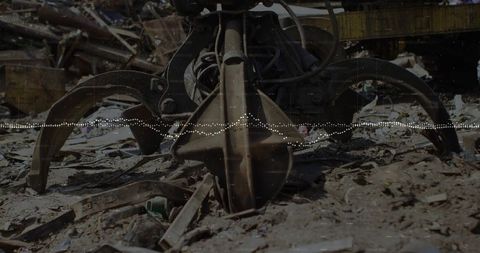
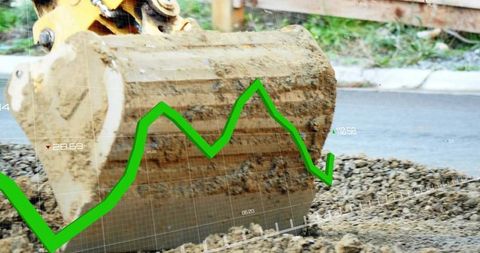
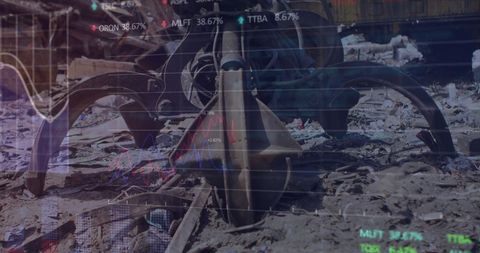
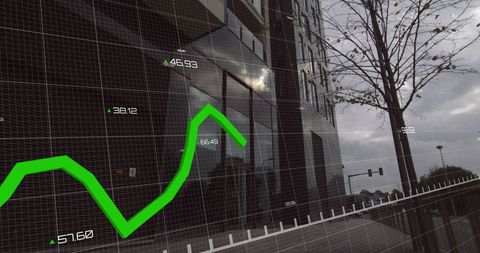
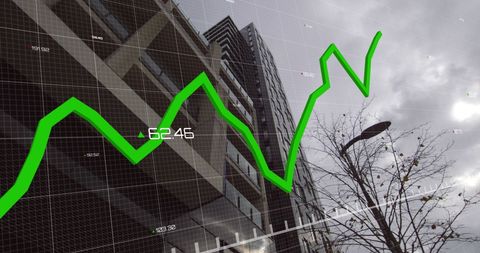
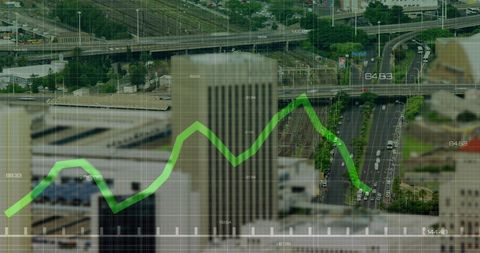
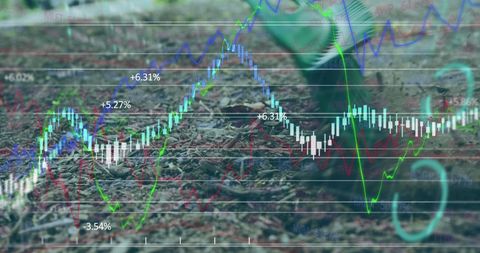
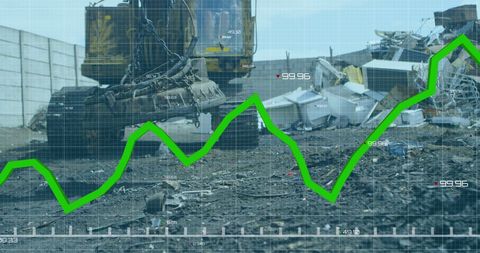
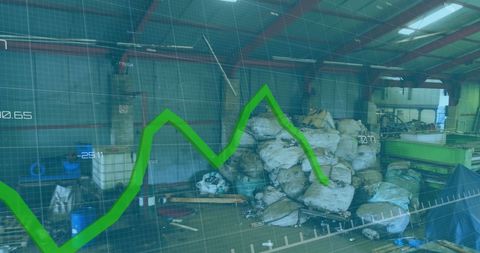
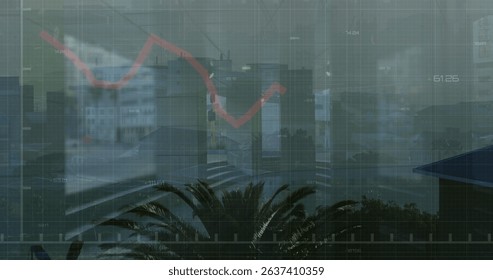
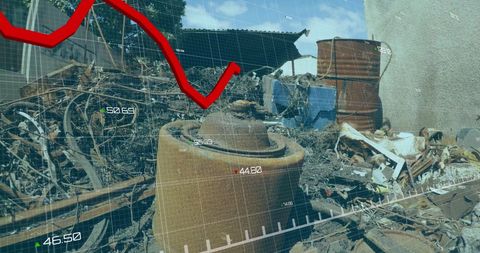
- Abstract Finance Trends Over Industrial Machinery
Abstract Finance Trends Over Industrial Machinery Image
Graph increases over industrial machinery surface, symbolizing business trends and data impact in manufacturing sector. Good for presentations, reports, or educational materials regrading finance and engineering fields.
Powered by  - Get 15% off with code: PIKWIZARD15


downloads
Tags:
More
Credit Photo
If you would like to credit the Photo, here are some ways you can do so
Text Link
photo Link
<span class="text-link">
<span>
<a target="_blank" href=https://pikwizard.com/photo/abstract-finance-trends-over-industrial-machinery/60d3c20a0a9a24a70197555d8b61e7a3/>PikWizard</a>
</span>
</span>
<span class="image-link">
<span
style="margin: 0 0 20px 0; display: inline-block; vertical-align: middle; width: 100%;"
>
<a
target="_blank"
href="https://pikwizard.com/photo/abstract-finance-trends-over-industrial-machinery/60d3c20a0a9a24a70197555d8b61e7a3/"
style="text-decoration: none; font-size: 10px; margin: 0;"
>
<img src="https://pikwizard.com/pw/medium/60d3c20a0a9a24a70197555d8b61e7a3.jpg" style="margin: 0; width: 100%;" alt="" />
<p style="font-size: 12px; margin: 0;">PikWizard</p>
</a>
</span>
</span>
Free (free of charge)
Free for personal and commercial use.
Author: Authentic Images
Similar Free Stock Images
Loading...
Premium
Premium

Premium


Premium


Premium


Premium


Premium


Premium


Premium

Premium


Premium


Premium


Premium


Premium


Premium

Premium


Premium


Premium


Premium


Premium


Premium


Premium
Premium


Premium


Premium