
- Home >
- Stock Photos >
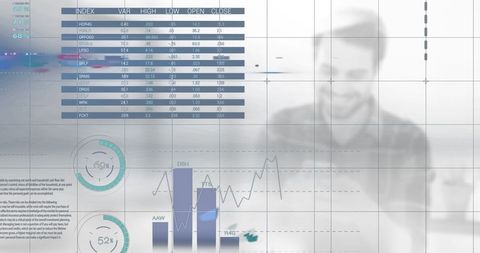
- Abstract Financial Analytics Dashboard with Virtual Data Display
Abstract Financial Analytics Dashboard with Virtual Data Display Image

Abstract interface showcasing financial analytics and data in virtual space. Candlesticks, gauges, and indexes appear layered over a blurred office setting, emphasizing technology in finance. Ideal for illustrating financial dashboards, data analysis tools, business presentations, and modern technology themes in reports or articles.
Powered by  - Get 15% off with code: PIKWIZARD15


downloads
Tags:
More
Credit Photo
If you would like to credit the Photo, here are some ways you can do so
Text Link
photo Link
<span class="text-link">
<span>
<a target="_blank" href=https://pikwizard.com/photo/abstract-financial-analytics-dashboard-with-virtual-data-display/2d3f5d90dd020bd78d2f42a7960dddea/>PikWizard</a>
</span>
</span>
<span class="image-link">
<span
style="margin: 0 0 20px 0; display: inline-block; vertical-align: middle; width: 100%;"
>
<a
target="_blank"
href="https://pikwizard.com/photo/abstract-financial-analytics-dashboard-with-virtual-data-display/2d3f5d90dd020bd78d2f42a7960dddea/"
style="text-decoration: none; font-size: 10px; margin: 0;"
>
<img src="https://pikwizard.com/pw/medium/2d3f5d90dd020bd78d2f42a7960dddea.jpg" style="margin: 0; width: 100%;" alt="" />
<p style="font-size: 12px; margin: 0;">PikWizard</p>
</a>
</span>
</span>
Free (free of charge)
Free for personal and commercial use.
Author: Authentic Images
Similar Free Stock Images

Premium


Premium

Premium


Premium


Premium


Premium


Premium


Premium

Premium


Premium

Premium

Premium


Premium


Premium


Premium


Premium


Premium


Premium


Premium

Premium

Premium


Premium


Premium


Premium


Premium


Explore More Free Stock Images