- Home >
- Stock Photos >
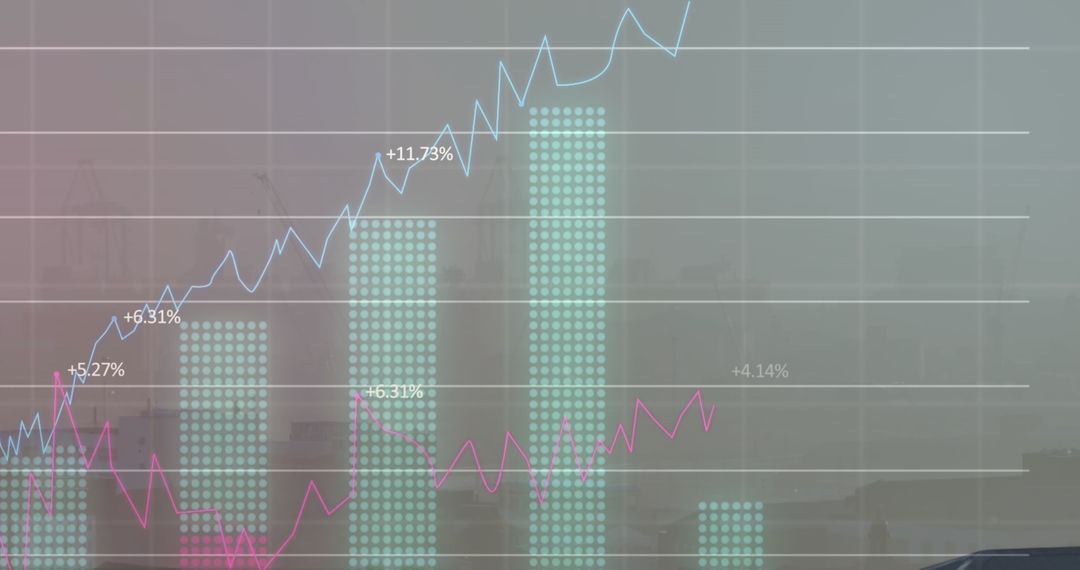
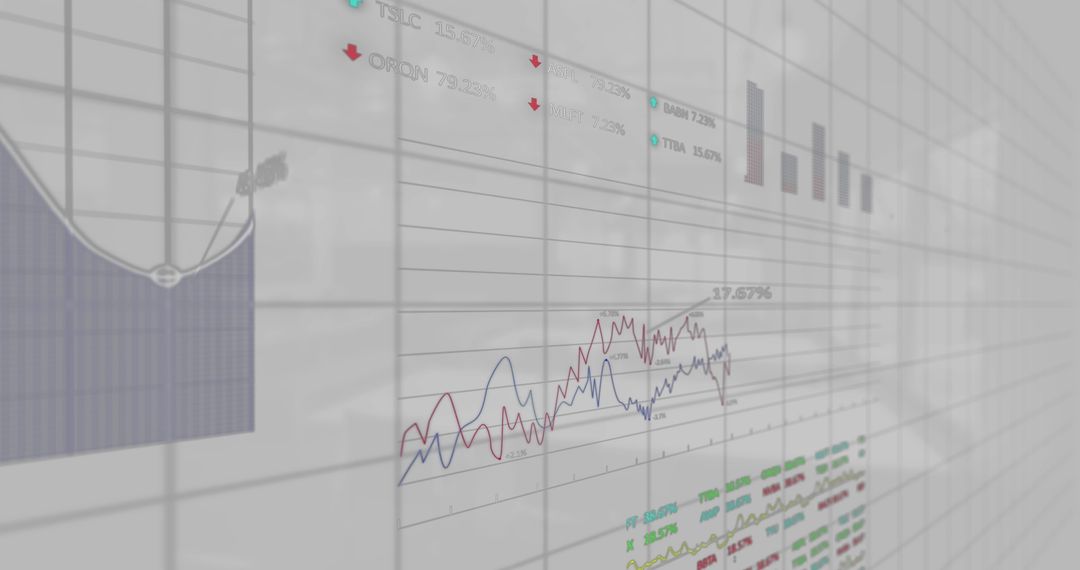
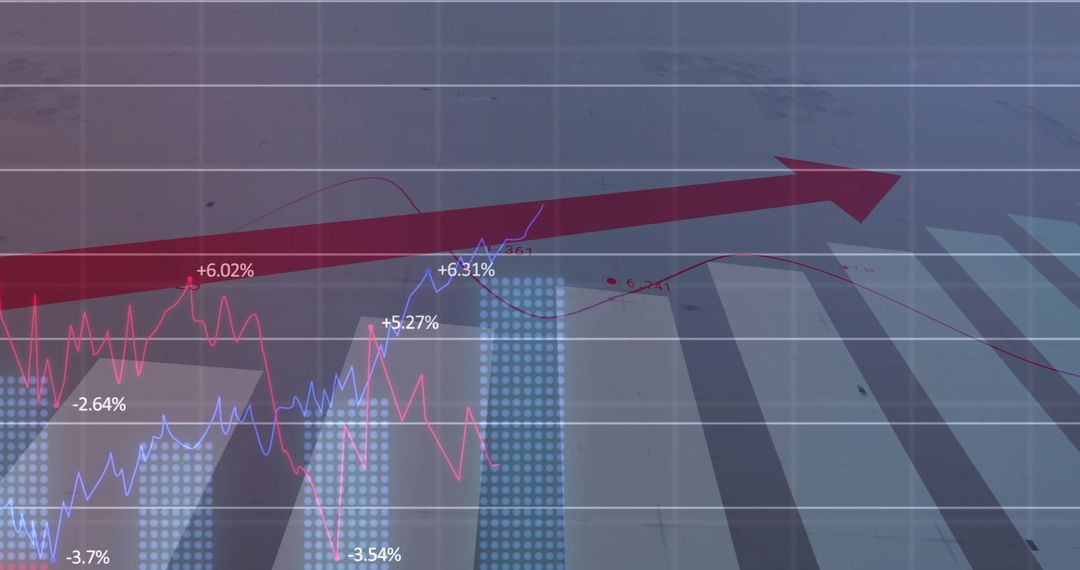
- Abstract Financial Analytics with Bar and Line Graphs
Abstract Financial Analytics with Bar and Line Graphs Image

An abstract representation of financial data visualizations including bar charts and line graphs. Shows gridlines and dynamic trends prevalent in financial markets, perfect for illustrating articles on stock trading, market analysis, or financial technology solutions. Ideal for creating eye-catching graphics for investment platforms or business analytics dashboards.
Powered by 


0
downloads
downloads
Tags:
More
Credit Photo
If you would like to credit the Photo, here are some ways you can do so
Text Link
photo Link
<span class="text-link">
<span>
<a target="_blank" href=https://pikwizard.com/photo/abstract-financial-analytics-with-bar-and-line-graphs/34f33184e2989b1e9424875d036138f8/>PikWizard</a>
</span>
</span>
<span class="image-link">
<span
style="margin: 0 0 20px 0; display: inline-block; vertical-align: middle; width: 100%;"
>
<a
target="_blank"
href="https://pikwizard.com/photo/abstract-financial-analytics-with-bar-and-line-graphs/34f33184e2989b1e9424875d036138f8/"
style="text-decoration: none; font-size: 10px; margin: 0;"
>
<img src="https://pikwizard.com/pw/medium/34f33184e2989b1e9424875d036138f8.jpg" style="margin: 0; width: 100%;" alt="" />
<p style="font-size: 12px; margin: 0;">PikWizard</p>
</a>
</span>
</span>
Free (free of charge)
Free for personal and commercial use.
Author: Authentic Images
Similar Free Stock Images

Premium


Premium


Premium


Premium


Premium


Premium


Premium


Premium


Premium


Premium


Premium


Premium


Premium


Premium


Premium


Premium


Premium


Premium


Premium


Premium


Premium


Premium


Premium


Premium