- Home >
- Stock Photos >
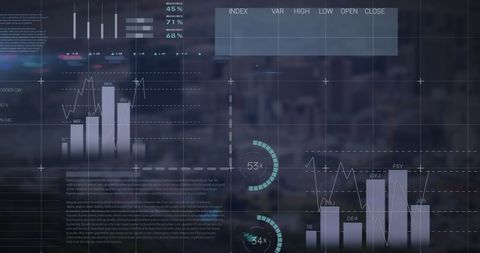
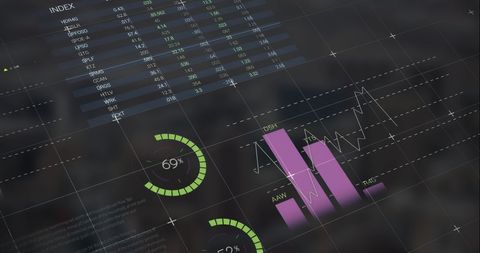
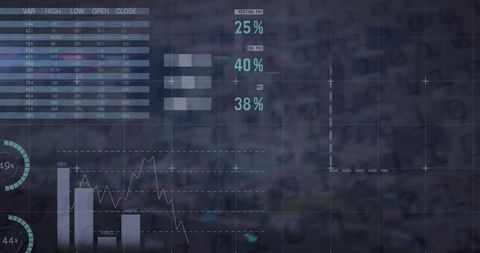
- Abstract Financial and Statistical Data Visualization on Screen
Abstract Financial and Statistical Data Visualization on Screen Image

This image showcases a digital interface filled with financial data visualizations, including graphs and analytics charts, set against a blue-toned backdrop. It can be used for presentations and articles related to economic trends, financial analysis, technology in business, and data processing strategies. Useful for illustrating concepts on global finances and business analytics.

downloads
Tags:
More
Credit Photo
If you would like to credit the Photo, here are some ways you can do so
Text Link
photo Link
<span class="text-link">
<span>
<a target="_blank" href=https://pikwizard.com/photo/abstract-financial-and-statistical-data-visualization-on-screen/a1cc5130a84d5140e38103b11fe045aa/>PikWizard</a>
</span>
</span>
<span class="image-link">
<span
style="margin: 0 0 20px 0; display: inline-block; vertical-align: middle; width: 100%;"
>
<a
target="_blank"
href="https://pikwizard.com/photo/abstract-financial-and-statistical-data-visualization-on-screen/a1cc5130a84d5140e38103b11fe045aa/"
style="text-decoration: none; font-size: 10px; margin: 0;"
>
<img src="https://pikwizard.com/pw/medium/a1cc5130a84d5140e38103b11fe045aa.jpg" style="margin: 0; width: 100%;" alt="" />
<p style="font-size: 12px; margin: 0;">PikWizard</p>
</a>
</span>
</span>
Free (free of charge)
Free for personal and commercial use.
Author: People Creations