- Home >
- Stock Photos >
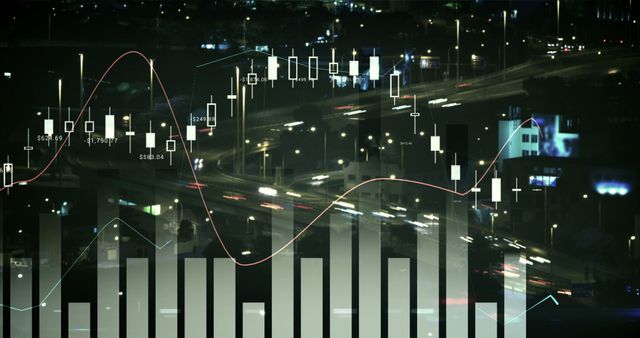
- Abstract Financial Chart and Technology Interface Visualization
Abstract Financial Chart and Technology Interface Visualization Image

This image illustrates a digital interface displaying financial data through a series of charts and graphs. Uses include illustrating articles on financial trends, presentations about economic growth, or business analytics reports. Blue background and abstract visual style convey a modern technology and finance theme, suitable for various business and finance content.

downloads
Tags:
More
Credit Photo
If you would like to credit the Photo, here are some ways you can do so
Text Link
photo Link
<span class="text-link">
<span>
<a target="_blank" href=https://pikwizard.com/photo/abstract-financial-chart-and-technology-interface-visualization/3842fb18049a3137370def532e4b6ea8/>PikWizard</a>
</span>
</span>
<span class="image-link">
<span
style="margin: 0 0 20px 0; display: inline-block; vertical-align: middle; width: 100%;"
>
<a
target="_blank"
href="https://pikwizard.com/photo/abstract-financial-chart-and-technology-interface-visualization/3842fb18049a3137370def532e4b6ea8/"
style="text-decoration: none; font-size: 10px; margin: 0;"
>
<img src="https://pikwizard.com/pw/medium/3842fb18049a3137370def532e4b6ea8.jpg" style="margin: 0; width: 100%;" alt="" />
<p style="font-size: 12px; margin: 0;">PikWizard</p>
</a>
</span>
</span>
Free (free of charge)
Free for personal and commercial use.
Author: Creative Art