- Home >
- Stock Photos >
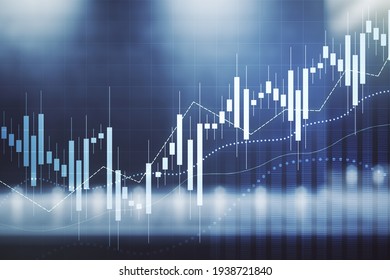
- Abstract Financial Chart Background with Bar and Line Graphs
Abstract Financial Chart Background with Bar and Line Graphs Image

Modern abstract background showcasing dynamic financial data with bar and line charts. Transparent overlay enhances design, offering a versatile concept for financial presentations and reports. This can be used in articles, business analytics, market discussions, and educational materials exploring financial trends.
Powered by  - Get 15% off with code: PIKWIZARD15


Credit Photo
If you would like to credit the Photo, here are some ways you can do so
Text Link
photo Link
<span class="text-link">
<span>
<a target="_blank" href=https://pikwizard.com/photo/abstract-financial-chart-background-with-bar-and-line-graphs/d94d0680e56a057c2db18933941de9ca/>PikWizard</a>
</span>
</span>
<span class="image-link">
<span
style="margin: 0 0 20px 0; display: inline-block; vertical-align: middle; width: 100%;"
>
<a
target="_blank"
href="https://pikwizard.com/photo/abstract-financial-chart-background-with-bar-and-line-graphs/d94d0680e56a057c2db18933941de9ca/"
style="text-decoration: none; font-size: 10px; margin: 0;"
>
<img src="https://pikwizard.com/pw/medium/d94d0680e56a057c2db18933941de9ca.jpg" style="margin: 0; width: 100%;" alt="" />
<p style="font-size: 12px; margin: 0;">PikWizard</p>
</a>
</span>
</span>
Free (free of charge)
Free for personal and commercial use.
Author: Awesome Content
Similar Free Stock Images

Premium


Premium


Premium


Premium


Premium


Premium


Premium


Premium


Premium


Premium


Premium


Premium


Premium


Premium


Premium


Premium


Premium


Premium


Premium


Premium


Premium


Premium


Premium


Premium