
- Home >
- Stock Photos >
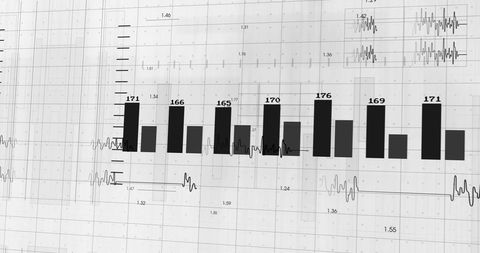
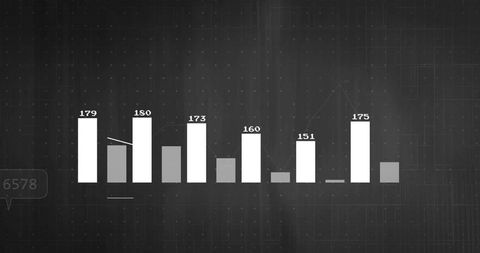
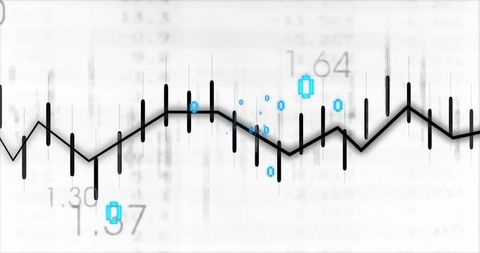
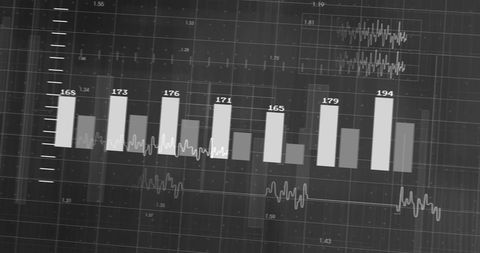
- Abstract Financial Chart Patterns on Digital Screen
Abstract Financial Chart Patterns on Digital Screen Image

Complex design of statistical charts combines line graphs and bar charts to depict data analysis patterns, perfect for illustrating data-driven business solutions. Suitable for use in financial services presentations, technology websites, economic forecast reports and digital marketing strategy visuals.
Powered by 


downloads
Tags:
More
Credit Photo
If you would like to credit the Photo, here are some ways you can do so
Text Link
photo Link
<span class="text-link">
<span>
<a target="_blank" href=https://pikwizard.com/photo/abstract-financial-chart-patterns-on-digital-screen/e8c6cf444ea1be6b409fc7c5233983e2/>PikWizard</a>
</span>
</span>
<span class="image-link">
<span
style="margin: 0 0 20px 0; display: inline-block; vertical-align: middle; width: 100%;"
>
<a
target="_blank"
href="https://pikwizard.com/photo/abstract-financial-chart-patterns-on-digital-screen/e8c6cf444ea1be6b409fc7c5233983e2/"
style="text-decoration: none; font-size: 10px; margin: 0;"
>
<img src="https://pikwizard.com/pw/medium/e8c6cf444ea1be6b409fc7c5233983e2.jpg" style="margin: 0; width: 100%;" alt="" />
<p style="font-size: 12px; margin: 0;">PikWizard</p>
</a>
</span>
</span>
Free (free of charge)
Free for personal and commercial use.
Author: People Creations
Similar Free Stock Images

Premium


Premium

Premium


Premium


Premium


Premium


Premium


Premium

Premium


Premium

Premium

Premium


Premium


Premium


Premium

Premium


Premium


Premium


Premium

Premium


Premium


Premium


Premium


Premium


Premium


Explore More Free Stock Images