1. Home > 
  2. Stock Photos > 
  3. Abstract Financial Chart Technology Interface

Abstract Financial Chart Technology Interface Image

Abstract Financial Chart Technology Interface

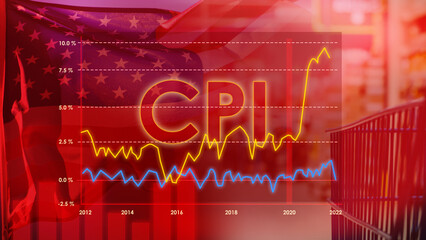
Modern financial chart design features red line and key data points, transforming global finance concepts into digital format. Essential for presentations on economics, financial reports, tech development, big data analysis, and educational or training materials.

Powered by Shutterstock logo - Get 15% off with code: PIKWIZARD15
Beautiful 3D red bar graph fall down following the arrow. - Powered by Shutterstock - Get 15% off with code: PIKWIZARD15Businessman touching data analytics process system with KPI financial charts, dashboard of stock and marketing on virtual interface. With Vietnam flag in background. - Powered by Shutterstock - Get 15% off with code: PIKWIZARD15Businessman touching data analytics process system with KPI financial charts, dashboard of stock and marketing on virtual interface. With Mexico flag in background. - Powered by Shutterstock - Get 15% off with code: PIKWIZARD15Businessman touching data analytics process system with KPI financial charts, dashboard of stock and marketing on virtual interface. With Egypt flag in background. - Powered by Shutterstock - Get 15% off with code: PIKWIZARD15Businessman touching data analytics process system with KPI financial charts, dashboard of stock and marketing on virtual interface. With Chile flag in background. - Powered by Shutterstock - Get 15% off with code: PIKWIZARD15

Credit Photo

If you would like to credit the Photo, here are some ways you can do so

Free (free of charge)

Free for personal and commercial use.

Author: Awesome Content

Similar Free Stock Images

Financial Analysis with Digital Data and Vibrant Graph
Premium
Businessman touching data analytics process system with KPI financial charts, dashboard of stock and marketing on virtual interface. With Italia flag in background.
Financial Data Overlay on Cityscape Visualizing Market Trends
Financial Data Visualization with Cityscape Overlay
Abstract Sound Waves on Dark Background
Colorful Bar Graph on Dark Background Illustrates Data Trends
Premium
Image of red line and financial data processing over dark background. Global finance, business, connections, computing and data processing concept digitally generated image.
Fluctuating Digital Stock Market Data Chart
Abstract Financial Chart Background with Bar and Line Graphs
Digital Data Analysis with Green Line Graph on Grid Background
Futuristic DNA Helix with Digital Lightning and Neon Grid Overlay
Premium
Image of red line, financial data processing over diverse business people in office. Global finance, business, connections, computing and data processing concept digitally generated image.
Global Finance and COVID-19 Impact Representation
Digital Finance Chart Overlaying Globe Background
Global Business Dashboard Overlay on Urban Skyline Background
Dynamic Colorful Waves on Black Digital Background
Premium
Businessman touching data analytics process system with KPI financial charts, dashboard of stock and marketing on virtual interface. With Switzerland flag in background.
Dynamic Green Line Graph Depicting Financial Data
Dynamic Financial Stock Market Graph
Dynamic Energy Particle Wave Concept on Metallic Gray Background
Financial Data Analysis Vibrant Graphs on Blue Background
Premium
Businessman touching data analytics process system with KPI financial charts, dashboard of stock and marketing on virtual interface. With Singapore flag in background.
Line Graph Illustrating Data Trend on Green Digital Background
Binary Code Data Over Financial Graph with Red Trends
Abstract Digital Data Graph and Diagrams on Gray Background
Financial Growth Stock Nikkei in Urban City Skyline
Premium
Businessman touching data analytics process system with KPI financial charts, dashboard of stock and marketing on virtual interface. With Philippines flag in background.
Futuristic Data Visualization on Global Map Interface
Futuristic Data Visualization with Bars and Trend Line
Neon Digital Data Dashboard with Interactive Analytics Interface
Cyan and Yellow Neon Waveform Moving Across Dark Gradient, Glowing Frequency Trails
Dynamic Financial Data Visualization with Blue Trends
Digital Financial Chart on Black Background with Neon Lines
Premium
Businessman touching data analytics process system with KPI financial charts, dashboard of stock and marketing on virtual interface. With Peoples Republic of China flag in background.
Colorful Digital Waveform Represents Global Connections
Economic and Political Factors Influence Investment Trends
Abstract Financial Graph with Bar and Line Charts on Dark Background
Futuristic Data Processing Animation with Media Icons
Premium
Businessman touching data analytics process system with KPI financial charts, dashboard of stock and marketing on virtual interface. With Colombia flag in background.
Abstract Financial Charts with Graphs and Data Visualization
Futuristic Stock Market Graph With Digital Overlay
Stagflation Concept with Digital Graphs and Data Patterns
Dynamic Data Visualization and Financial Growth Curves
Premium
Businessman touching data analytics process system with KPI financial charts, dashboard of stock and marketing on virtual interface. With Ecuador flag in background.
Financial Graphs Overlaying Shopping Bag Representation Economy
Data Analysis with Advanced Technology Interface Details Profusion
Digital Data Stream and Holographic Analysis Visualization
Digital Simulated Global Financial Data and Graphs
Premium
Businessman touching data analytics process system with KPI financial charts, dashboard of stock and marketing on virtual interface. With Spain flag in background.
Dynamic Green Stock Market Chart with Upward Arrows
Abstract Data Visualization on Blue Background for Technology Concept
Financial Data Analysis on Blue Digital Interface
Digital Stock Market Display with Data Analysis Graphics
Premium
Hands pointing at colorful business charts and graphs spread across a wooden table under natural daylight, symbolizing teamwork, analysis, and the creative process of modern strategic planning.
Glowing Financial Graph with World Map in Dark Background
Abstract Representation of Financial Data Processing
Fluctuating Stock Market Graph with Dramatic Peaks
Financial Data Analysis with Graphs on Grey Background
Premium
Image of red lines, financial data processing, flag of china over cityscape. Global business, finance, data processing and global economy concept digitally generated image.
Trend Analysis with Candlestick Chart and Data Indicators
Futuristic Neon Financial Chart with Candlestick Indicators
Displaying Neon Candlestick Chart with Curved Trend Line, Data Markers and Hex Grid
Graph Lines Portraying Financial Data Trends
Abstract Digital Financial Chart on Blue Background
Digital Financial Data Overlaying City Skyline at Dusk
Premium
Image of red lines and financial data processing over diverse business people in office. Global finance, business, connections, computing and data processing concept digitally generated image.
Financial Data Flow against Urban Skyline Backdrop
Abstract Financial Graph Illustration on Dark Background
Dynamic Financial Growth Representing Business Trends
Innovative Data Analysis with Dynamic Line Graph and Digital Elements
Premium
Displaying fingerprint line scanning on security screen, with stock grid and candlestick chart. Cybersecurity, finance, digital, biometric, analytics, data visualization, control room
Dynamic Stock Market Data on Digital Interface
Data Trends and Analysis on 3D Digital Grid
Data Analytics Graphs on Digital Interface Background
Futuristic Digital Data Visualization on Blue Background
Premium
Image of red line and data processing over office. Global finance, business, connections, computing and data processing concept digitally generated image.
Dynamic Digital Soundwave Pattern on Dark Background
Abstract Data Visualization with Dynamic Charts and Graphs
City Skyline with Overlay of Financial Market Trends
Financial Data Processing Visualization with Green Digital Grid
Premium
Businessman touching data analytics process system with KPI financial charts, dashboard of stock and marketing on virtual interface. With Thailand flag in background.
Data Analysis Graphics on Digital Grid Background
Dynamic Financial Data Processing in Green Sphere
Dynamic Financial Graphs Overlaying Urban Skyline
Green Line Graph with Data Points on Grid Background
Premium
Korean woman wearing top pressing dough pieces on floured surface in bakery, with financial overlay. Artisan, craftsmanship, culinary, bakery, financial, data visualization, concentration
Digital Data Processing with Floating Point Graphics
Global Financial Data Analysis with Green Growth Arrows on Blue Background
Abstract Digital Waveform Display with Numerical Data
Minimalistic Digital Financial Analytics Chart with Candlesticks
Premium
Image of red line, financial data processing, flag of china over cityscape. Global business, finance, data processing and global economy concept digitally generated image.
Futuristic Digital Interface with Rotating Elements and Waveform
Glowing neon waveforms pulsing across dark canvas in teal cyan orange dotted trails
Abstract Financial Chart Overlay with Sporadic White Lines
Dynamic Digital Financial Data Interface Background
Abstract DNA Helix Digital Network
Neon Network on Purple Background with Glowing Connectivity Lines
Premium
Beautiful red bar graph decreasing.
Rising Financial Market Trends with Data Visualization
Abstract Financial Chart Over Modern Cityscape
Abstract Neon Waves on Dark Background Concept
Abstract Digital Chart in Futuristic Financial Analysis Concept
Premium
Businessman touching data analytics process system with KPI financial charts, dashboard of stock and marketing on virtual interface. With Peru flag in background.
Digital Data Network with Dynamic Connections
Abstract Digital Finance Chart Showing Fluctuating Graph Lines
Dynamic Financial Data Visualizations on Grid Interface
Abstract Digital Financial Data Chart with Pink Line Oscillations
Premium
Businessman touching data analytics process system with KPI financial charts, dashboard of stock and marketing on virtual interface. With Australia flag in background.
Digital Data Chart on Grey Background with Red Trend Line
Futuristic Digital Data Graphs and World Map
Digital Graph with Rising and Falling Lines on Grid Background
Abstract Digital Waves Over Striped Background
Premium
Businessman touching data analytics process system with KPI financial charts, dashboard of stock and marketing on virtual interface. With Austria flag in background.
Analyzing Financial Data on Digital World Map Background
Cityscape with Digital Stock Market Graphs and Statistics
Upward Stock Market Arrow with Binary Code Background
Dynamic Data Graphs Display on Dark Digital Background
Premium
Image of red line, statistics and financial data processing over desk in office. Global business, finance, computing and data processing concept digitally generated image.
Colorful Waveforms on Blue Background
Financial Trading Chart Overlaying World Map with Red Trend Line
Financial Digital Dashboard Displaying Market Trends and Data Analysis
Red Line Graph Displaying Complex Digital Trend Analysis
Premium
Image of red line, flag of china and financial data processing over factory. Global business, finance, data processing and digital interface concept digitally generated image.
Flowing Teal Waveform Ribbons and Neon Spikes with Gold Bokeh for Data Visualization