- Home >
- Stock Photos >
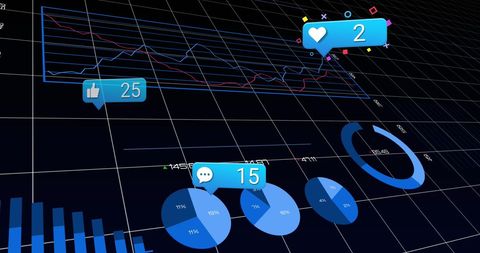
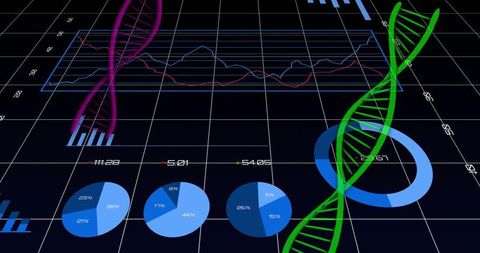
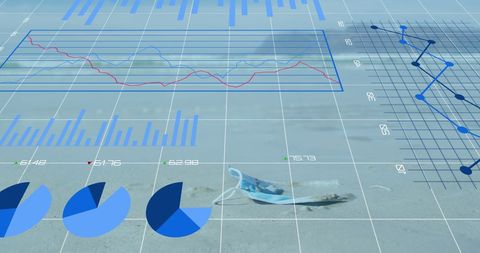
- Abstract Financial Chart with Dynamic 3D Data Visualizations
Abstract Financial Chart with Dynamic 3D Data Visualizations Image

This visual of dynamic 3D data visualizations illustrates financial charts with columns and plots, prominently featuring a striking green line. The abstract representation suggests complex data analysis and processing, resonating with themes of global business and financial assessment. Ideal for use in financial reporting presentations, data processing demonstrations, and educational material on statistics and computing.

downloads
Tags:
More
Credit Photo
If you would like to credit the Photo, here are some ways you can do so
Text Link
photo Link
<span class="text-link">
<span>
<a target="_blank" href=https://pikwizard.com/photo/abstract-financial-chart-with-dynamic-3d-data-visualizations/8e748f206f504889e64301c159383d73/>PikWizard</a>
</span>
</span>
<span class="image-link">
<span
style="margin: 0 0 20px 0; display: inline-block; vertical-align: middle; width: 100%;"
>
<a
target="_blank"
href="https://pikwizard.com/photo/abstract-financial-chart-with-dynamic-3d-data-visualizations/8e748f206f504889e64301c159383d73/"
style="text-decoration: none; font-size: 10px; margin: 0;"
>
<img src="https://pikwizard.com/pw/medium/8e748f206f504889e64301c159383d73.jpg" style="margin: 0; width: 100%;" alt="" />
<p style="font-size: 12px; margin: 0;">PikWizard</p>
</a>
</span>
</span>
Free (free of charge)
Free for personal and commercial use.
Author: People Creations