- Home >
- Stock Photos >
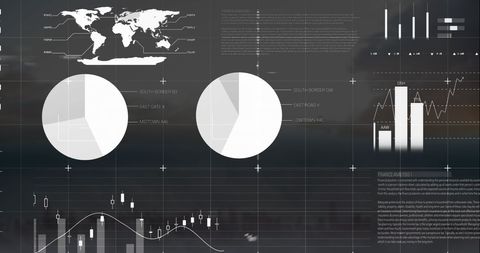
- Abstract Financial Chart with Pie and Bar Graphs on White Background
Abstract Financial Chart with Pie and Bar Graphs on White Background Image

This abstract image features various financial charts, including pie graphs and bar charts, on a white background. Ideal for business presentations, financial analysis reports, or marketing materials related to economy and data-driven industries. The monochromatic style adds a professional and modern touch, perfect for demonstrating analytics and insights.
Powered by 


33
downloads
downloads
Tags:
More
Credit Photo
If you would like to credit the Photo, here are some ways you can do so
Text Link
photo Link
<span class="text-link">
<span>
<a target="_blank" href=https://pikwizard.com/photo/abstract-financial-chart-with-pie-and-bar-graphs-on-white-background/13c10b493a4dd17a861b0d0f6a3b7665/>PikWizard</a>
</span>
</span>
<span class="image-link">
<span
style="margin: 0 0 20px 0; display: inline-block; vertical-align: middle; width: 100%;"
>
<a
target="_blank"
href="https://pikwizard.com/photo/abstract-financial-chart-with-pie-and-bar-graphs-on-white-background/13c10b493a4dd17a861b0d0f6a3b7665/"
style="text-decoration: none; font-size: 10px; margin: 0;"
>
<img src="https://pikwizard.com/pw/medium/13c10b493a4dd17a861b0d0f6a3b7665.jpg" style="margin: 0; width: 100%;" alt="" />
<p style="font-size: 12px; margin: 0;">PikWizard</p>
</a>
</span>
</span>
Free (free of charge)
Free for personal and commercial use.
Author: Authentic Images
Similar Free Stock Images

Premium


Premium


Premium


Premium


Premium


Premium


Premium


Premium


Premium


Premium


Premium


Premium


Premium


Premium


Premium


Premium


Premium


Premium


Premium


Premium


Premium


Premium


Premium


Premium


Premium