
- Home >
- Stock Photos >
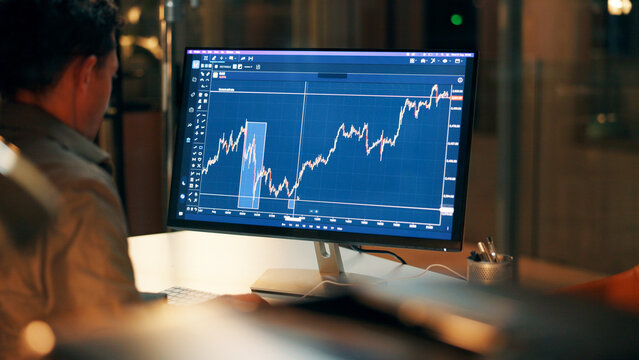
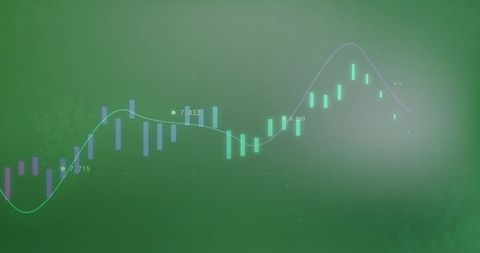
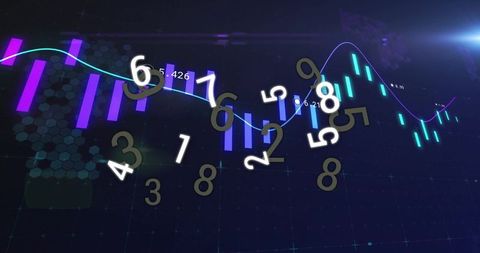
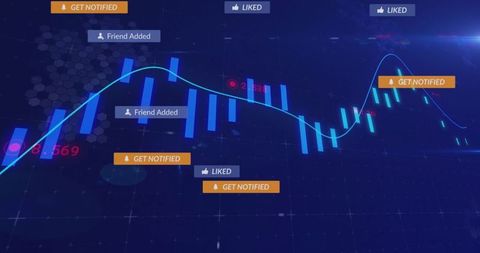
- Abstract Financial Chart with Virtual Analytics and Data Visualization
Abstract Financial Chart with Virtual Analytics and Data Visualization Image

Visual depicts modern data analytics with colorful bars and trend lines, ideal for illustrations about finance, stock market predictions, and technology integration. Bright and engaging colors make it suitable for presentations on financial trends, AI applications in economics, or cybersecurity analytics. Useful for articles detailing economic forecasts or displaying business intelligence tools.
Powered by 


downloads
Tags:
More
Credit Photo
If you would like to credit the Photo, here are some ways you can do so
Text Link
photo Link
<span class="text-link">
<span>
<a target="_blank" href=https://pikwizard.com/photo/abstract-financial-chart-with-virtual-analytics-and-data-visualization/693a3f74d4478ab00c4e92b1b99127fc/>PikWizard</a>
</span>
</span>
<span class="image-link">
<span
style="margin: 0 0 20px 0; display: inline-block; vertical-align: middle; width: 100%;"
>
<a
target="_blank"
href="https://pikwizard.com/photo/abstract-financial-chart-with-virtual-analytics-and-data-visualization/693a3f74d4478ab00c4e92b1b99127fc/"
style="text-decoration: none; font-size: 10px; margin: 0;"
>
<img src="https://pikwizard.com/pw/medium/693a3f74d4478ab00c4e92b1b99127fc.jpg" style="margin: 0; width: 100%;" alt="" />
<p style="font-size: 12px; margin: 0;">PikWizard</p>
</a>
</span>
</span>
Free (free of charge)
Free for personal and commercial use.
Author: Creative Art
Similar Free Stock Images

Premium


Premium


Premium


Premium


Premium


Premium


Premium


Premium

Premium


Premium

Premium


Premium


Premium


Premium

Premium


Premium

Premium

Premium


Premium


Premium


Premium


Premium


Premium


Premium


Premium


Explore More Free Stock Images